Zip Codes with the Highest Percentage of Population Employed in Utilities in Missoula, MT
RELATED REPORTS & OPTIONS
Utilities
Missoula
Compare Zip Codes
Map of Zip Codes with the Highest Percentage of Population Employed in Utilities in Missoula
0.19%
1.3%
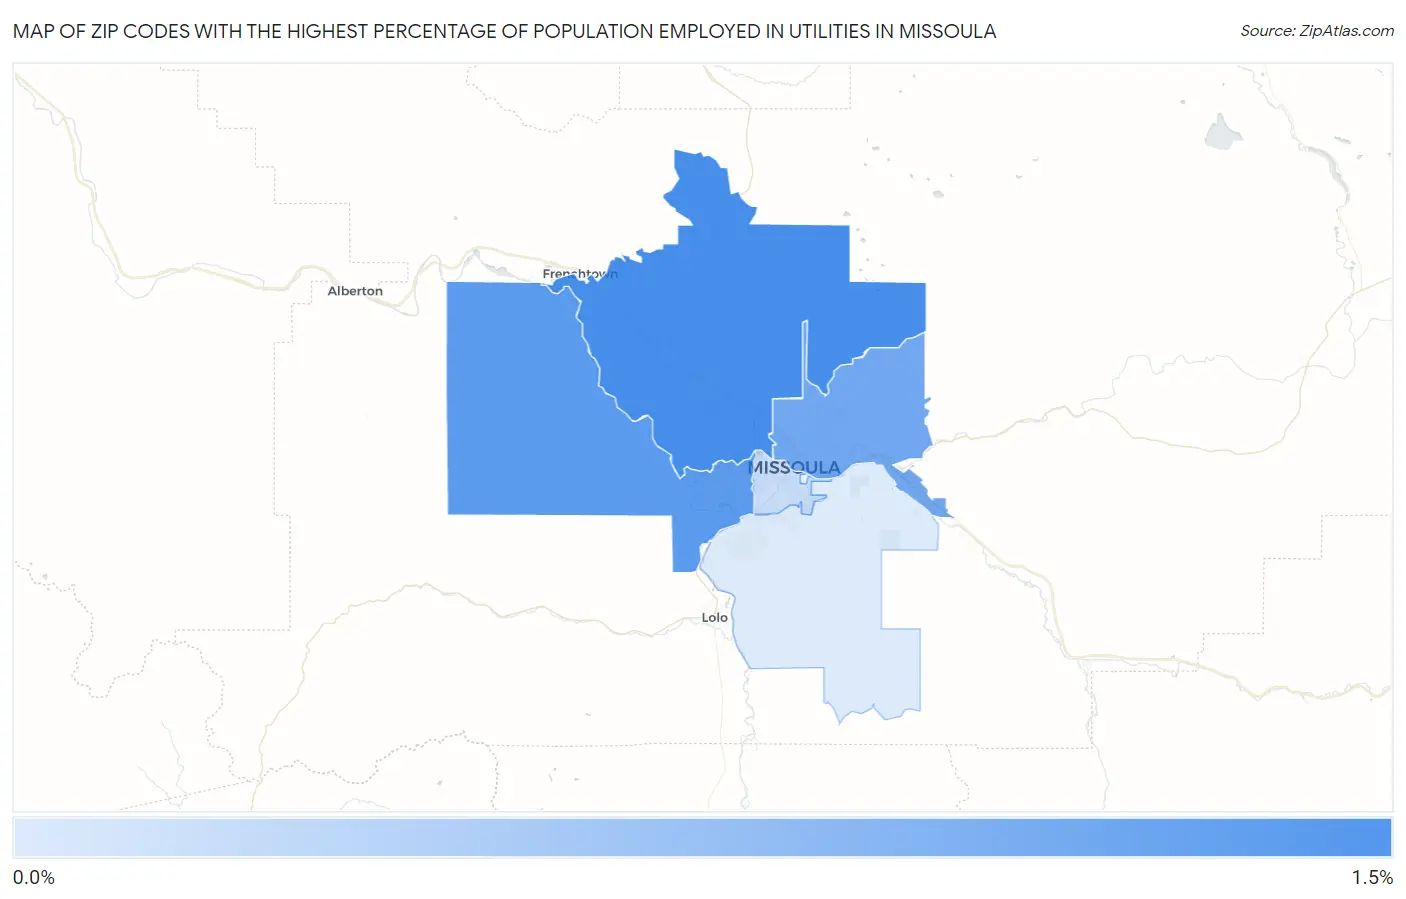
Zip Codes with the Highest Percentage of Population Employed in Utilities in Missoula, MT
| Zip Code | % Employed | vs State | vs National | |
| 1. | 59808 | 1.3% | 0.91%(+0.357)#78 | 0.84%(+0.431)#8,215 |
| 2. | 59804 | 1.1% | 0.91%(+0.209)#86 | 0.84%(+0.283)#9,324 |
| 3. | 59802 | 0.97% | 0.91%(+0.056)#93 | 0.84%(+0.130)#10,673 |
| 4. | 59801 | 0.34% | 0.91%(-0.570)#138 | 0.84%(-0.496)#18,399 |
| 5. | 59803 | 0.19% | 0.91%(-0.726)#148 | 0.84%(-0.651)#20,444 |
1
Common Questions
What are the Top 5 Zip Codes with the Highest Percentage of Population Employed in Utilities in Missoula, MT?
Top 5 Zip Codes with the Highest Percentage of Population Employed in Utilities in Missoula, MT are:
What zip code has the Highest Percentage of Population Employed in Utilities in Missoula, MT?
59808 has the Highest Percentage of Population Employed in Utilities in Missoula, MT with 1.3%.
What is the Percentage of Population Employed in Utilities in Missoula, MT?
Percentage of Population Employed in Utilities in Missoula is 0.54%.
What is the Percentage of Population Employed in Utilities in Montana?
Percentage of Population Employed in Utilities in Montana is 0.91%.
What is the Percentage of Population Employed in Utilities in the United States?
Percentage of Population Employed in Utilities in the United States is 0.84%.