Zip Codes with the Highest Percentage of Immigrants from Eastern Europe in Missoula, MT
RELATED REPORTS & OPTIONS
Eastern Europe
Missoula
Compare Zip Codes
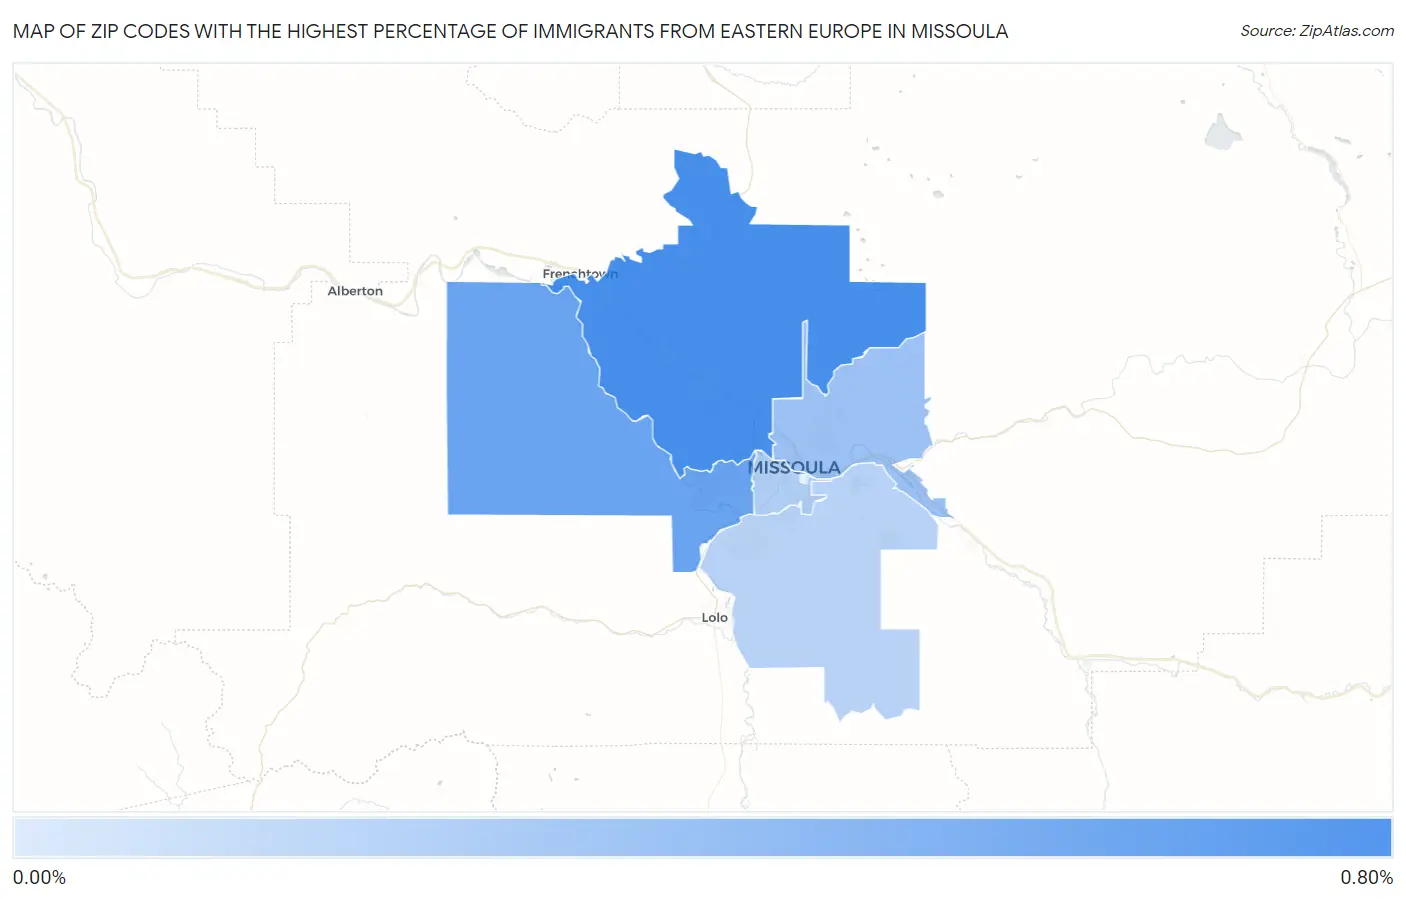
Map of Zip Codes with the Highest Percentage of Immigrants from Eastern Europe in Missoula
0.18%
0.72%
Zip Codes with the Highest Percentage of Immigrants from Eastern Europe in Missoula, MT
| Zip Code | Eastern Europe | vs State | vs National | |
| 1. | 59808 | 0.72% | 0.23%(+0.490)#17 | 0.67%(+0.057)#4,103 |
| 2. | 59804 | 0.56% | 0.23%(+0.327)#21 | 0.67%(-0.106)#5,082 |
| 3. | 59802 | 0.32% | 0.23%(+0.084)#29 | 0.67%(-0.350)#7,271 |
| 4. | 59801 | 0.21% | 0.23%(-0.028)#39 | 0.67%(-0.461)#8,820 |
| 5. | 59803 | 0.18% | 0.23%(-0.053)#41 | 0.67%(-0.486)#9,266 |
1
Common Questions
What are the Top 5 Zip Codes with the Highest Percentage of Immigrants from Eastern Europe in Missoula, MT?
Top 5 Zip Codes with the Highest Percentage of Immigrants from Eastern Europe in Missoula, MT are:
What zip code has the Highest Percentage of Immigrants from Eastern Europe in Missoula, MT?
59808 has the Highest Percentage of Immigrants from Eastern Europe in Missoula, MT with 0.72%.
What is the Percentage of Immigrants from Eastern Europe in Missoula, MT?
Percentage of Immigrants from Eastern Europe in Missoula is 0.14%.
What is the Percentage of Immigrants from Eastern Europe in Montana?
Percentage of Immigrants from Eastern Europe in Montana is 0.23%.
What is the Percentage of Immigrants from Eastern Europe in the United States?
Percentage of Immigrants from Eastern Europe in the United States is 0.67%.