Zip Codes with the Highest Percentage of Immigrants from China in Missoula, MT
RELATED REPORTS & OPTIONS
China
Missoula
Compare Zip Codes
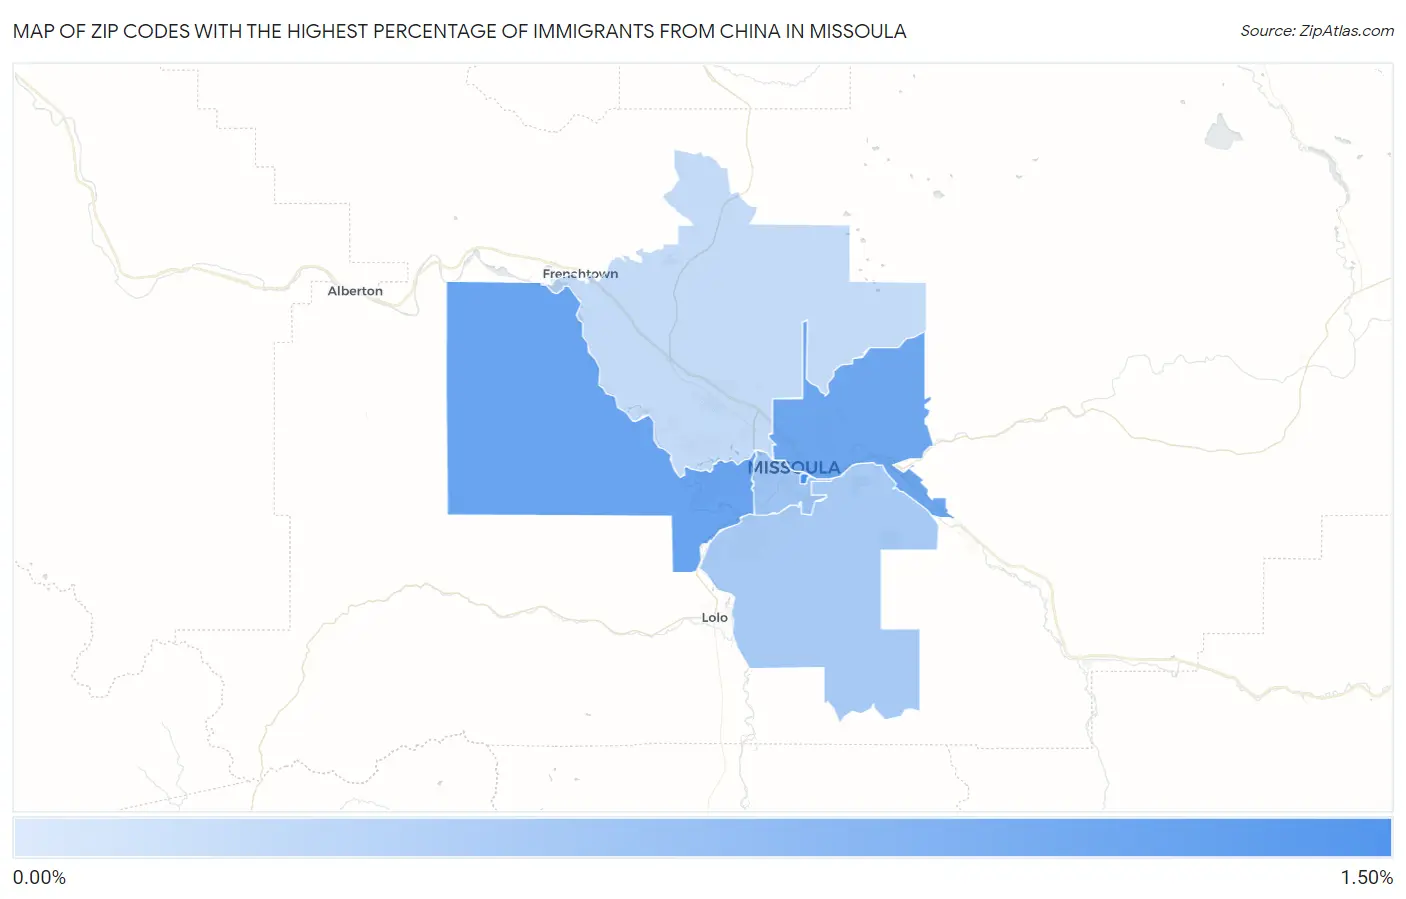
Map of Zip Codes with the Highest Percentage of Immigrants from China in Missoula
0.19%
1.14%
Zip Codes with the Highest Percentage of Immigrants from China in Missoula, MT
| Zip Code | China | vs State | vs National | |
| 1. | 59812 | 1.14% | 0.15%(+0.989)#3 | 0.85%(+0.284)#2,179 |
| 2. | 59804 | 0.87% | 0.15%(+0.717)#6 | 0.85%(+0.012)#2,771 |
| 3. | 59802 | 0.84% | 0.15%(+0.690)#7 | 0.85%(-0.015)#2,834 |
| 4. | 59801 | 0.46% | 0.15%(+0.314)#12 | 0.85%(-0.391)#4,513 |
| 5. | 59803 | 0.40% | 0.15%(+0.248)#13 | 0.85%(-0.457)#5,042 |
| 6. | 59808 | 0.19% | 0.15%(+0.042)#22 | 0.85%(-0.662)#7,286 |
1
Common Questions
What are the Top 5 Zip Codes with the Highest Percentage of Immigrants from China in Missoula, MT?
Top 5 Zip Codes with the Highest Percentage of Immigrants from China in Missoula, MT are:
What zip code has the Highest Percentage of Immigrants from China in Missoula, MT?
59812 has the Highest Percentage of Immigrants from China in Missoula, MT with 1.14%.
What is the Percentage of Immigrants from China in Missoula, MT?
Percentage of Immigrants from China in Missoula is 0.55%.
What is the Percentage of Immigrants from China in Montana?
Percentage of Immigrants from China in Montana is 0.15%.
What is the Percentage of Immigrants from China in the United States?
Percentage of Immigrants from China in the United States is 0.85%.