Zip Codes with the Highest Percentage of Population Employed in Legal Services & Support in Jackson, MS
RELATED REPORTS & OPTIONS
Legal Services & Support
Jackson
Compare Zip Codes
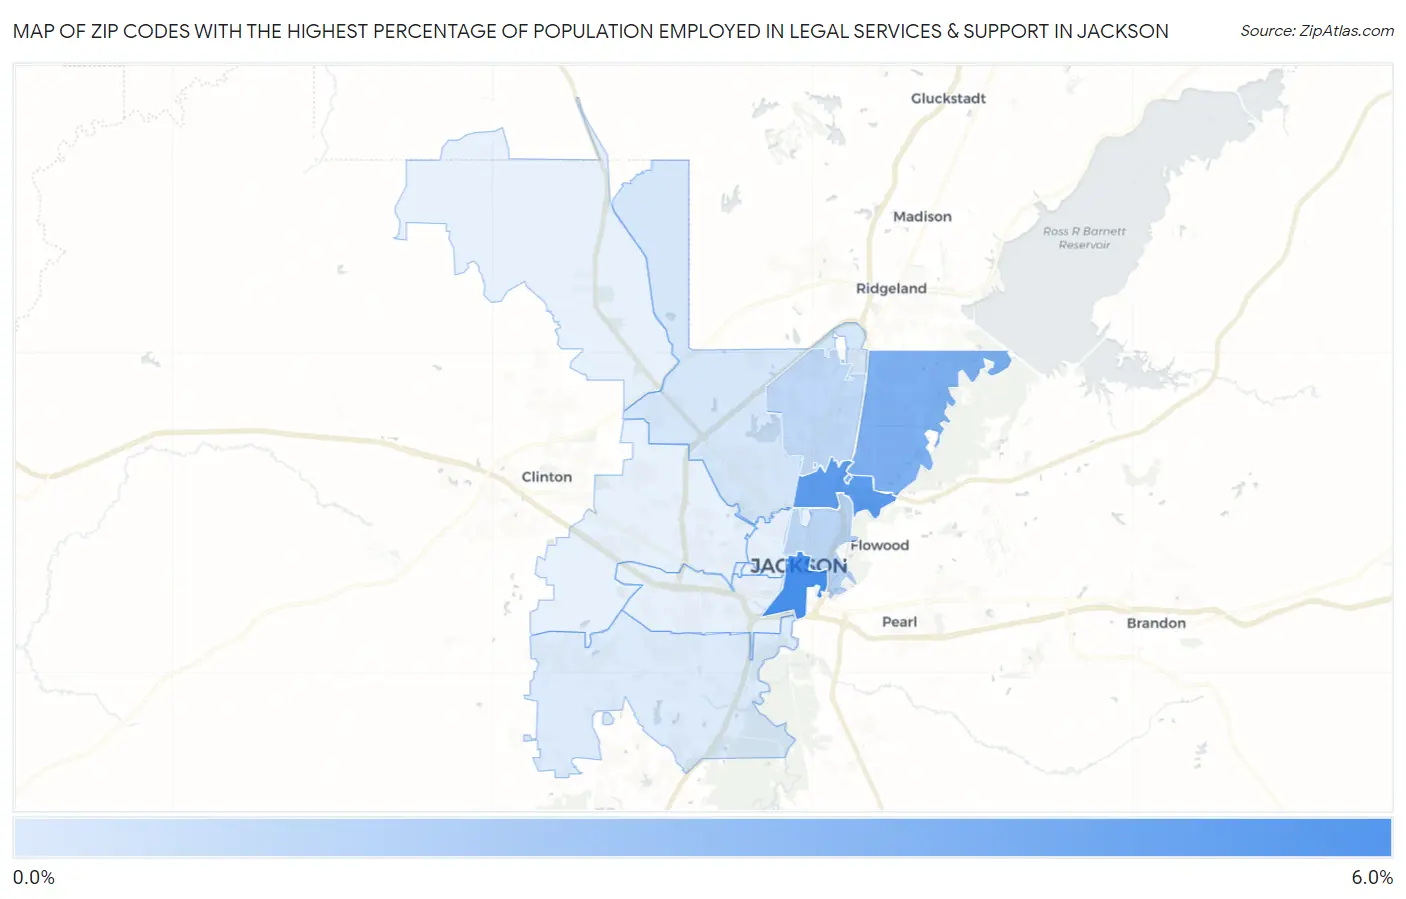
Map of Zip Codes with the Highest Percentage of Population Employed in Legal Services & Support in Jackson
0.20%
5.2%
Zip Codes with the Highest Percentage of Population Employed in Legal Services & Support in Jackson, MS
| Zip Code | % Employed | vs State | vs National | |
| 1. | 39201 | 5.2% | 0.75%(+4.48)#5 | 1.2%(+4.04)#656 |
| 2. | 39216 | 4.5% | 0.75%(+3.73)#6 | 1.2%(+3.29)#906 |
| 3. | 39211 | 3.3% | 0.75%(+2.58)#13 | 1.2%(+2.14)#1,558 |
| 4. | 39202 | 1.2% | 0.75%(+0.489)#55 | 1.2%(+0.051)#6,294 |
| 5. | 39206 | 1.2% | 0.75%(+0.446)#58 | 1.2%(+0.008)#6,553 |
| 6. | 39213 | 0.44% | 0.75%(-0.306)#110 | 1.2%(-0.744)#13,360 |
| 7. | 39212 | 0.20% | 0.75%(-0.547)#152 | 1.2%(-0.985)#16,203 |
1
Common Questions
What are the Top 10 Zip Codes with the Highest Percentage of Population Employed in Legal Services & Support in Jackson, MS?
Top 10 Zip Codes with the Highest Percentage of Population Employed in Legal Services & Support in Jackson, MS are:
What zip code has the Highest Percentage of Population Employed in Legal Services & Support in Jackson, MS?
39201 has the Highest Percentage of Population Employed in Legal Services & Support in Jackson, MS with 5.2%.
What is the Percentage of Population Employed in Legal Services & Support in Jackson, MS?
Percentage of Population Employed in Legal Services & Support in Jackson is 1.1%.
What is the Percentage of Population Employed in Legal Services & Support in Mississippi?
Percentage of Population Employed in Legal Services & Support in Mississippi is 0.75%.
What is the Percentage of Population Employed in Legal Services & Support in the United States?
Percentage of Population Employed in Legal Services & Support in the United States is 1.2%.