Zip Codes with the Highest Percentage of Households Heated by Bottled Gas / Liquid Propane in Jackson, MS
RELATED REPORTS & OPTIONS
Bottled Gas / LP Heating
Jackson
Compare Zip Codes
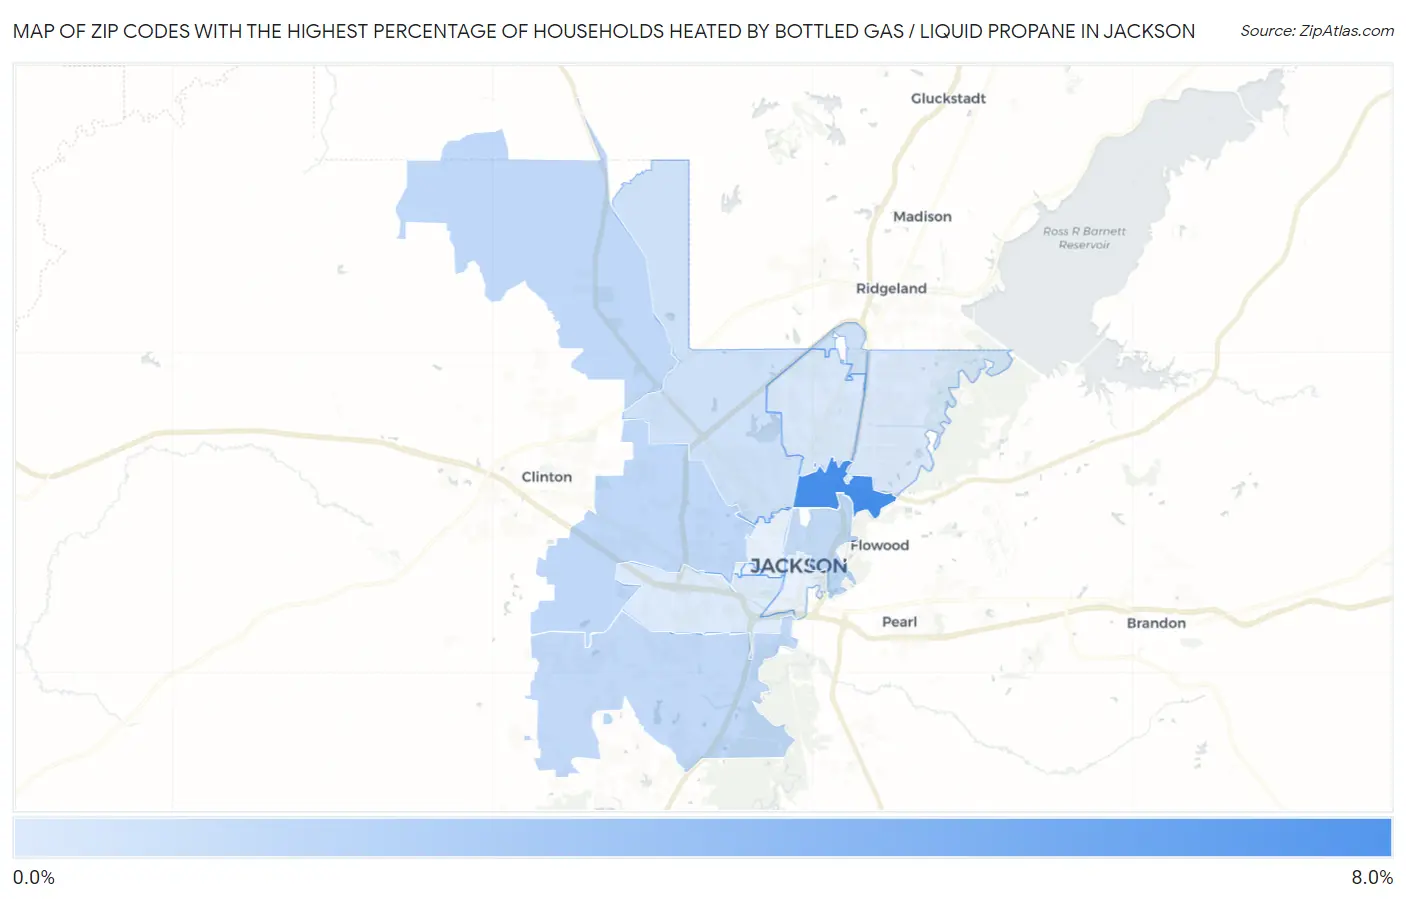
Map of Zip Codes with the Highest Percentage of Households Heated by Bottled Gas / Liquid Propane in Jackson
0.40%
7.6%
Zip Codes with the Highest Percentage of Households Heated by Bottled Gas / Liquid Propane in Jackson, MS
| Zip Code | Bottled Gas / LP Heating | vs State | vs National | |
| 1. | 39216 | 7.6% | 10.4%(-2.80)#292 | 4.9%(+2.70)#16,285 |
| 2. | 39209 | 1.8% | 10.4%(-8.60)#360 | 4.9%(-3.10)#23,766 |
| 3. | 39212 | 1.7% | 10.4%(-8.70)#362 | 4.9%(-3.20)#24,041 |
| 4. | 39202 | 1.6% | 10.4%(-8.80)#368 | 4.9%(-3.30)#24,523 |
| 5. | 39213 | 1.0% | 10.4%(-9.40)#374 | 4.9%(-3.90)#26,766 |
| 6. | 39206 | 0.60% | 10.4%(-9.80)#379 | 4.9%(-4.30)#28,296 |
| 7. | 39211 | 0.50% | 10.4%(-9.90)#380 | 4.9%(-4.40)#28,631 |
| 8. | 39204 | 0.40% | 10.4%(-10.00)#381 | 4.9%(-4.50)#28,996 |
1
Common Questions
What are the Top 10 Zip Codes with the Highest Percentage of Households Heated by Bottled Gas / Liquid Propane in Jackson, MS?
Top 10 Zip Codes with the Highest Percentage of Households Heated by Bottled Gas / Liquid Propane in Jackson, MS are:
What zip code has the Highest Percentage of Households Heated by Bottled Gas / Liquid Propane in Jackson, MS?
39216 has the Highest Percentage of Households Heated by Bottled Gas / Liquid Propane in Jackson, MS with 7.6%.
What is the Percentage of Households Heated by Bottled Gas / Liquid Propane in Jackson, MS?
Percentage of Households Heated by Bottled Gas / Liquid Propane in Jackson is 1.0%.
What is the Percentage of Households Heated by Bottled Gas / Liquid Propane in Mississippi?
Percentage of Households Heated by Bottled Gas / Liquid Propane in Mississippi is 10.4%.
What is the Percentage of Households Heated by Bottled Gas / Liquid Propane in the United States?
Percentage of Households Heated by Bottled Gas / Liquid Propane in the United States is 4.9%.