Zip Codes with the Highest Percentage of Population with a Degree in Liberal Arts and History in Jackson, MS
RELATED REPORTS & OPTIONS
Liberal Arts and History
Jackson
Compare Zip Codes
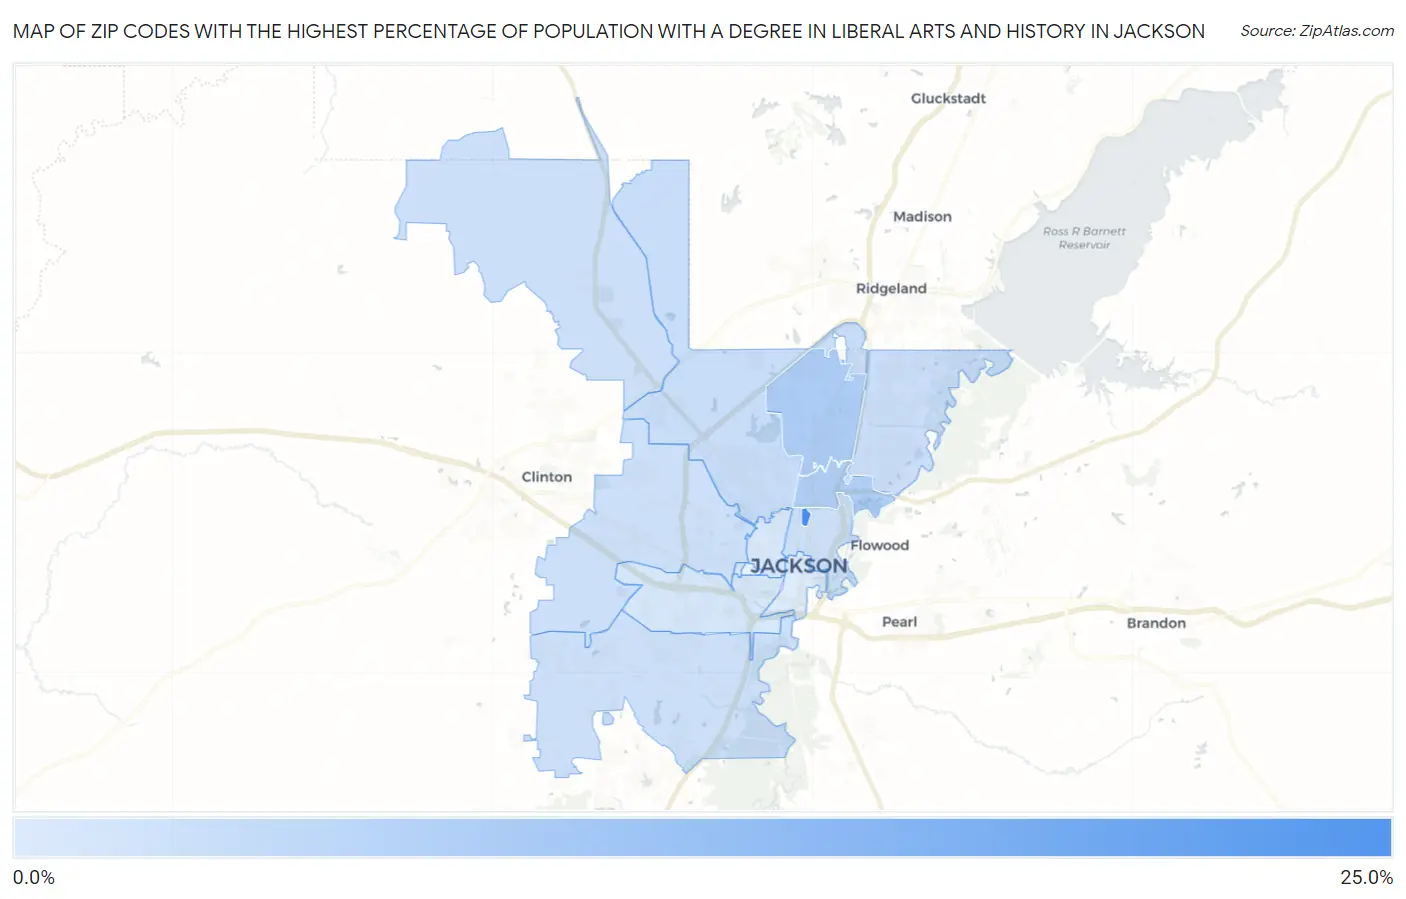
Map of Zip Codes with the Highest Percentage of Population with a Degree in Liberal Arts and History in Jackson
1.2%
22.7%
Zip Codes with the Highest Percentage of Population with a Degree in Liberal Arts and History in Jackson, MS
| Zip Code | % Graduates | vs State | vs National | |
| 1. | 39210 | 22.7% | 4.2%(+18.6)#14 | 4.9%(+17.9)#692 |
| 2. | 39206 | 7.7% | 4.2%(+3.56)#57 | 4.9%(+2.84)#5,271 |
| 3. | 39216 | 7.0% | 4.2%(+2.86)#69 | 4.9%(+2.15)#6,358 |
| 4. | 39213 | 3.9% | 4.2%(-0.255)#143 | 4.9%(-0.971)#15,171 |
| 5. | 39211 | 3.6% | 4.2%(-0.540)#150 | 4.9%(-1.26)#16,191 |
| 6. | 39212 | 3.3% | 4.2%(-0.808)#155 | 4.9%(-1.52)#17,147 |
| 7. | 39209 | 3.2% | 4.2%(-0.920)#157 | 4.9%(-1.64)#17,539 |
| 8. | 39202 | 3.1% | 4.2%(-1.01)#160 | 4.9%(-1.73)#17,851 |
| 9. | 39204 | 2.2% | 4.2%(-1.92)#194 | 4.9%(-2.63)#20,728 |
| 10. | 39203 | 1.7% | 4.2%(-2.48)#223 | 4.9%(-3.20)#22,140 |
| 11. | 39201 | 1.2% | 4.2%(-2.97)#241 | 4.9%(-3.69)#23,068 |
1
Common Questions
What are the Top 10 Zip Codes with the Highest Percentage of Population with a Degree in Liberal Arts and History in Jackson, MS?
Top 10 Zip Codes with the Highest Percentage of Population with a Degree in Liberal Arts and History in Jackson, MS are:
What zip code has the Highest Percentage of Population with a Degree in Liberal Arts and History in Jackson, MS?
39210 has the Highest Percentage of Population with a Degree in Liberal Arts and History in Jackson, MS with 22.7%.
What is the Percentage of Population with a Degree in Liberal Arts and History in Jackson, MS?
Percentage of Population with a Degree in Liberal Arts and History in Jackson is 4.7%.
What is the Percentage of Population with a Degree in Liberal Arts and History in Mississippi?
Percentage of Population with a Degree in Liberal Arts and History in Mississippi is 4.2%.
What is the Percentage of Population with a Degree in Liberal Arts and History in the United States?
Percentage of Population with a Degree in Liberal Arts and History in the United States is 4.9%.