Zip Codes with the Highest Percentage of Population with a Degree in Liberal Arts and History in Annapolis, MD
RELATED REPORTS & OPTIONS
Liberal Arts and History
Annapolis
Compare Zip Codes
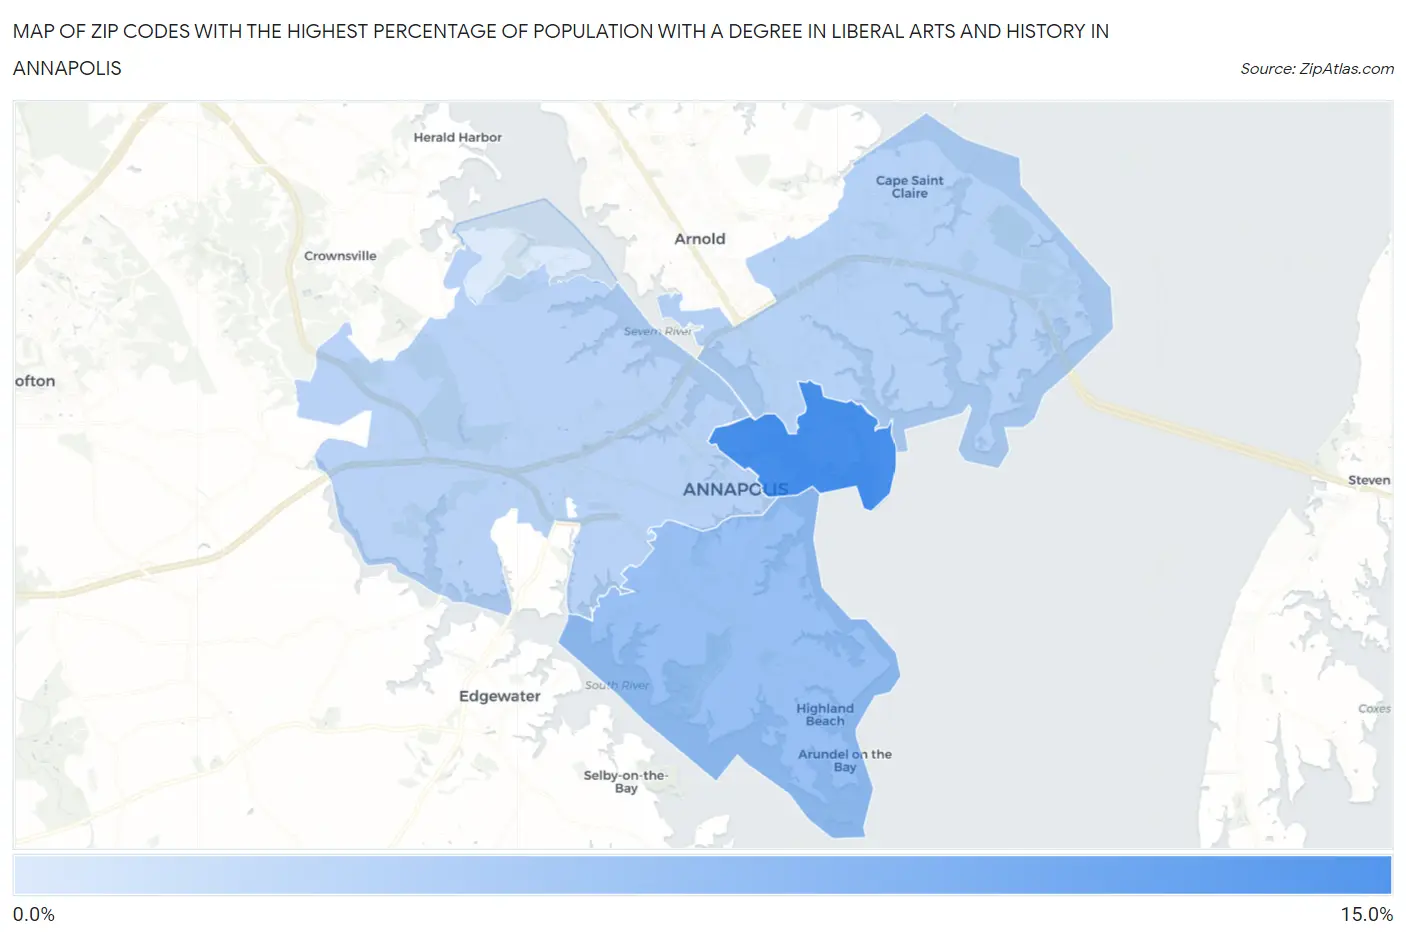
Map of Zip Codes with the Highest Percentage of Population with a Degree in Liberal Arts and History in Annapolis
4.6%
11.6%
Zip Codes with the Highest Percentage of Population with a Degree in Liberal Arts and History in Annapolis, MD
| Zip Code | % Graduates | vs State | vs National | |
| 1. | 21402 | 11.6% | 5.0%(+6.61)#36 | 4.9%(+6.77)#2,316 |
| 2. | 21403 | 7.8% | 5.0%(+2.72)#87 | 4.9%(+2.88)#5,233 |
| 3. | 21409 | 6.4% | 5.0%(+1.33)#116 | 4.9%(+1.49)#7,646 |
| 4. | 21401 | 6.3% | 5.0%(+1.28)#119 | 4.9%(+1.44)#7,766 |
| 5. | 21405 | 4.6% | 5.0%(-0.419)#216 | 4.9%(-0.257)#12,602 |
1
Common Questions
What are the Top 3 Zip Codes with the Highest Percentage of Population with a Degree in Liberal Arts and History in Annapolis, MD?
Top 3 Zip Codes with the Highest Percentage of Population with a Degree in Liberal Arts and History in Annapolis, MD are:
What zip code has the Highest Percentage of Population with a Degree in Liberal Arts and History in Annapolis, MD?
21402 has the Highest Percentage of Population with a Degree in Liberal Arts and History in Annapolis, MD with 11.6%.
What is the Percentage of Population with a Degree in Liberal Arts and History in Annapolis, MD?
Percentage of Population with a Degree in Liberal Arts and History in Annapolis is 6.2%.
What is the Percentage of Population with a Degree in Liberal Arts and History in Maryland?
Percentage of Population with a Degree in Liberal Arts and History in Maryland is 5.0%.
What is the Percentage of Population with a Degree in Liberal Arts and History in the United States?
Percentage of Population with a Degree in Liberal Arts and History in the United States is 4.9%.