Zip Codes with the Highest Percentage of Population with a Degree in Liberal Arts and History in New Iberia, LA
RELATED REPORTS & OPTIONS
Liberal Arts and History
New Iberia
Compare Zip Codes
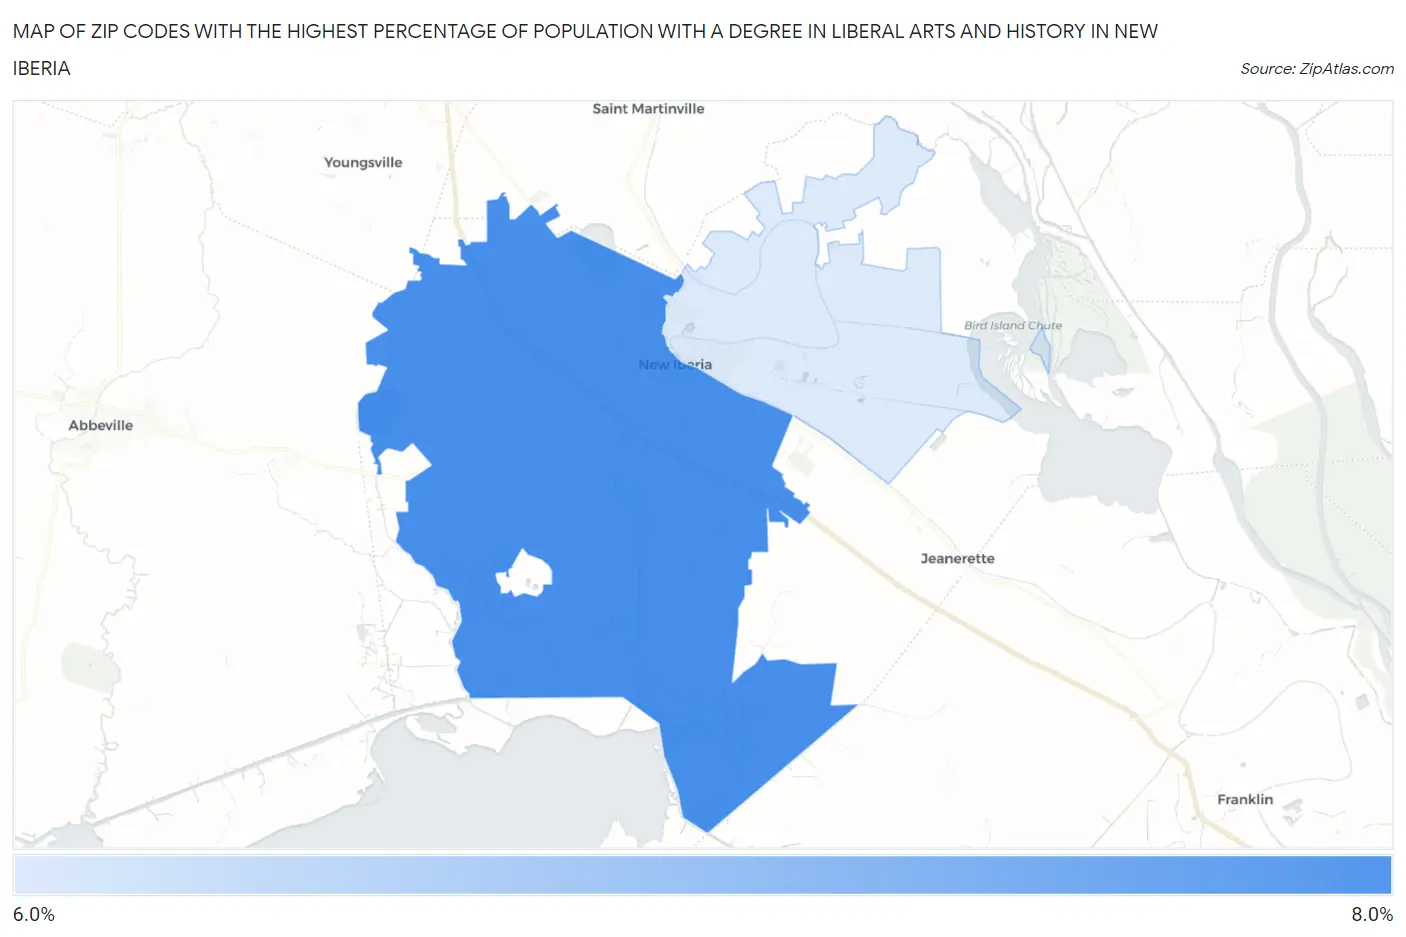
Map of Zip Codes with the Highest Percentage of Population with a Degree in Liberal Arts and History in New Iberia
6.9%
7.7%
Zip Codes with the Highest Percentage of Population with a Degree in Liberal Arts and History in New Iberia, LA
| Zip Code | % Graduates | vs State | vs National | |
| 1. | 70560 | 7.7% | 7.4%(+0.220)#178 | 4.9%(+2.80)#5,351 |
| 2. | 70563 | 6.9% | 7.4%(-0.508)#205 | 4.9%(+2.07)#6,492 |
1
Common Questions
What are the Top Zip Codes with the Highest Percentage of Population with a Degree in Liberal Arts and History in New Iberia, LA?
Top Zip Codes with the Highest Percentage of Population with a Degree in Liberal Arts and History in New Iberia, LA are:
What zip code has the Highest Percentage of Population with a Degree in Liberal Arts and History in New Iberia, LA?
70560 has the Highest Percentage of Population with a Degree in Liberal Arts and History in New Iberia, LA with 7.7%.
What is the Percentage of Population with a Degree in Liberal Arts and History in New Iberia, LA?
Percentage of Population with a Degree in Liberal Arts and History in New Iberia is 10.0%.
What is the Percentage of Population with a Degree in Liberal Arts and History in Louisiana?
Percentage of Population with a Degree in Liberal Arts and History in Louisiana is 7.4%.
What is the Percentage of Population with a Degree in Liberal Arts and History in the United States?
Percentage of Population with a Degree in Liberal Arts and History in the United States is 4.9%.