Zip Codes with the Highest Percentage of Population Employed in Administrative & Support Services in New Iberia, LA
RELATED REPORTS & OPTIONS
Administrative & Support Services
New Iberia
Compare Zip Codes
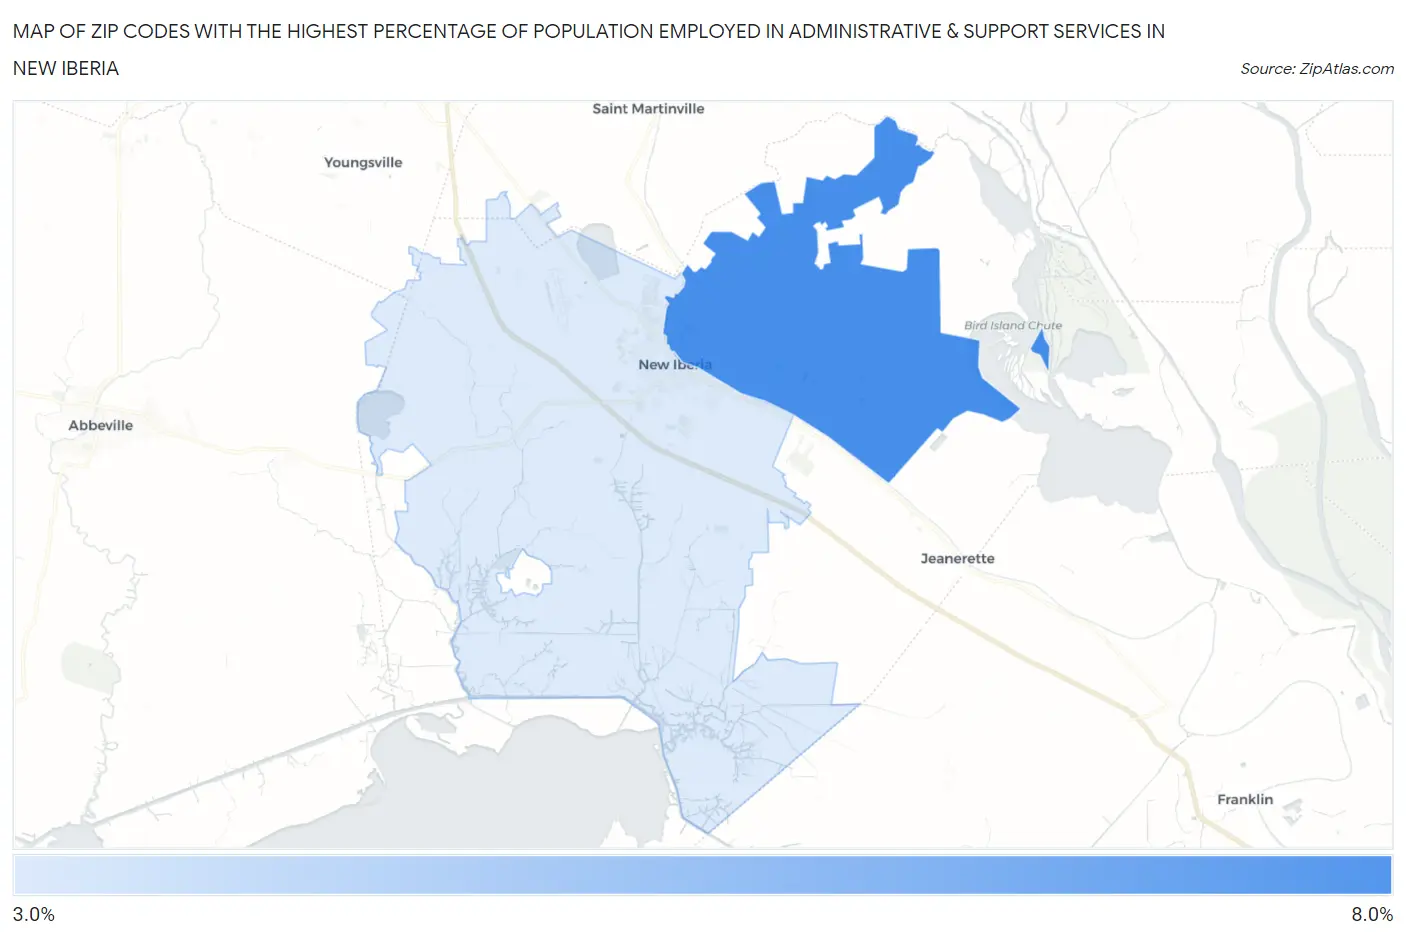
Map of Zip Codes with the Highest Percentage of Population Employed in Administrative & Support Services in New Iberia
3.1%
6.3%
Zip Codes with the Highest Percentage of Population Employed in Administrative & Support Services in New Iberia, LA
| Zip Code | % Employed | vs State | vs National | |
| 1. | 70563 | 6.3% | 3.8%(+2.51)#79 | 4.1%(+2.12)#4,283 |
| 2. | 70560 | 3.1% | 3.8%(-0.647)#242 | 4.1%(-1.03)#14,887 |
1
Common Questions
What are the Top Zip Codes with the Highest Percentage of Population Employed in Administrative & Support Services in New Iberia, LA?
Top Zip Codes with the Highest Percentage of Population Employed in Administrative & Support Services in New Iberia, LA are:
What zip code has the Highest Percentage of Population Employed in Administrative & Support Services in New Iberia, LA?
70563 has the Highest Percentage of Population Employed in Administrative & Support Services in New Iberia, LA with 6.3%.
What is the Percentage of Population Employed in Administrative & Support Services in New Iberia, LA?
Percentage of Population Employed in Administrative & Support Services in New Iberia is 4.1%.
What is the Percentage of Population Employed in Administrative & Support Services in Louisiana?
Percentage of Population Employed in Administrative & Support Services in Louisiana is 3.8%.
What is the Percentage of Population Employed in Administrative & Support Services in the United States?
Percentage of Population Employed in Administrative & Support Services in the United States is 4.1%.