Zip Codes with the Highest Percentage of Households Without a Vehicle in Bossier City, LA
RELATED REPORTS & OPTIONS
Households without a Cars
Bossier City
Compare Zip Codes
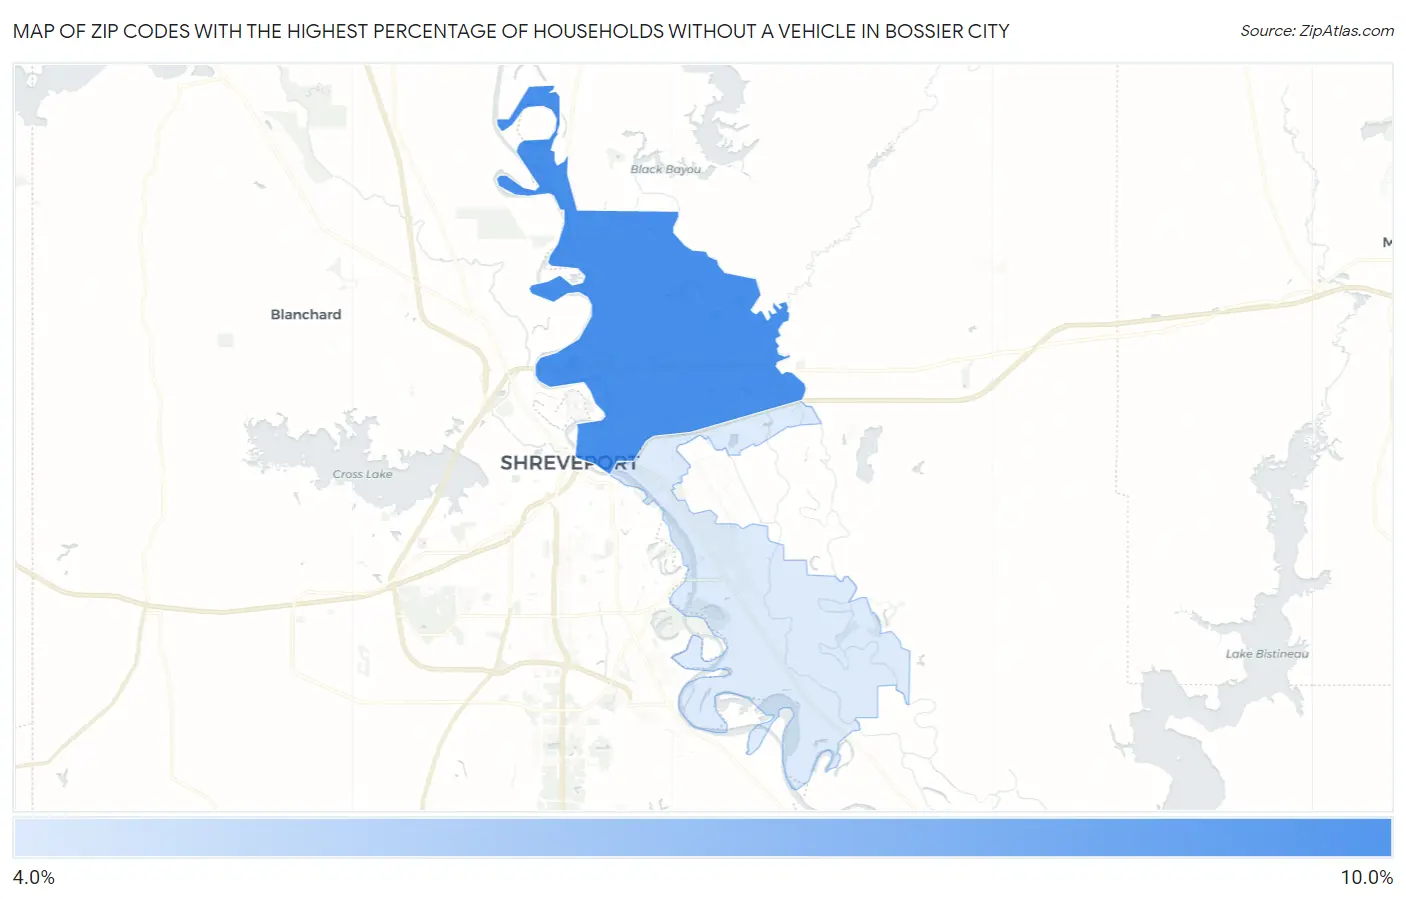
Map of Zip Codes with the Highest Percentage of Households Without a Vehicle in Bossier City
4.8%
9.9%
Zip Codes with the Highest Percentage of Households Without a Vehicle in Bossier City, LA
| Zip Code | Housholds Without a Car | vs State | vs National | |
| 1. | 71111 | 9.9% | 8.3%(+1.60)#133 | 8.3%(+1.60)#4,930 |
| 2. | 71112 | 4.8% | 8.3%(-3.50)#293 | 8.3%(-3.50)#13,349 |
1
Common Questions
What are the Top Zip Codes with the Highest Percentage of Households Without a Vehicle in Bossier City, LA?
Top Zip Codes with the Highest Percentage of Households Without a Vehicle in Bossier City, LA are:
What zip code has the Highest Percentage of Households Without a Vehicle in Bossier City, LA?
71111 has the Highest Percentage of Households Without a Vehicle in Bossier City, LA with 9.9%.
What is the Percentage of Households Without a Vehicle in Bossier City, LA?
Percentage of Households Without a Vehicle in Bossier City is 8.5%.
What is the Percentage of Households Without a Vehicle in Louisiana?
Percentage of Households Without a Vehicle in Louisiana is 8.3%.
What is the Percentage of Households Without a Vehicle in the United States?
Percentage of Households Without a Vehicle in the United States is 8.3%.