Zip Codes with the Highest Percentage of Population Taking Taxi / Cab to Work in Wichita, KS

RELATED REPORTS & OPTIONS

Taxi / Cab
Population
Families and Households
Female Fertility
Female Fertility (Unmarried)
Race (Community Size)
Race (Percentage)
Ancestry (Community Size)
AfricanAlaska NativeAmericanApacheArabArapahoArgentineanArmenianAustralianAustrianBangladeshiBarbadianBelgianBhutaneseBlackfeetBolivianBrazilianBritishBulgarianBurmeseCajunCanadianCelticCentral AmericanCentral American IndianCherokeeCheyenneChickasawChileanChippewaChoctawColombianComancheCosta RicanCreekCroatianCubanCzechCzechoslovakianDanishDelawareDominicanDutchDutch West IndianEastern EuropeanEcuadorianEgyptianEnglishEthiopianEuropeanFilipinoFinnishFrenchFrench American IndianFrench CanadianGermanGerman RussianGhanaianGreekGuamanian / ChamorroGuatemalanHaitianHonduranHungarianIcelanderIndian (Asian)IndonesianInupiatIranianIrishIroquoisItalianJamaicanJapaneseJordanianKenyanKiowaKoreanLaotianLebaneseLithuanianLuxembourgerMalaysianMexicanMexican American IndianMongolianMoroccanNative HawaiianNavajoNicaraguanNigerianNorthern EuropeanNorwegianOsageOttawaPakistaniPalestinianPanamanianParaguayanPennsylvania GermanPeruvianPimaPolishPortuguesePotawatomiPuebloPuerto RicanRomanianRussianSalvadoranSamoanScandinavianScotch-IrishScottishSeminoleSiouxSlavicSlovakSloveneSouth AfricanSouth AmericanSpaniardSpanishSpanish AmericanSpanish American IndianSri LankanSubsaharan AfricanSwedishSwissSyrianThaiTrinidadian and TobagonianTurkishUgandanUkrainianVenezuelanWelshWest IndianYugoslavian
Ancestry (Percentage)
AfricanAlaska NativeAmericanApacheArabArapahoArgentineanArmenianAustralianAustrianBangladeshiBarbadianBelgianBhutaneseBlackfeetBolivianBrazilianBritishBulgarianBurmeseCajunCanadianCelticCentral AmericanCentral American IndianCherokeeCheyenneChickasawChileanChippewaChoctawColombianComancheCosta RicanCreekCroatianCubanCzechCzechoslovakianDanishDelawareDominicanDutchDutch West IndianEastern EuropeanEcuadorianEgyptianEnglishEthiopianEuropeanFilipinoFinnishFrenchFrench American IndianFrench CanadianGermanGerman RussianGhanaianGreekGuamanian / ChamorroGuatemalanHaitianHonduranHungarianIcelanderIndian (Asian)IndonesianInupiatIranianIrishIroquoisItalianJamaicanJapaneseJordanianKenyanKiowaKoreanLaotianLebaneseLithuanianLuxembourgerMalaysianMexicanMexican American IndianMongolianMoroccanNative HawaiianNavajoNicaraguanNigerianNorthern EuropeanNorwegianOsageOttawaPakistaniPalestinianPanamanianParaguayanPennsylvania GermanPeruvianPimaPolishPortuguesePotawatomiPuebloPuerto RicanRomanianRussianSalvadoranSamoanScandinavianScotch-IrishScottishSeminoleSiouxSlavicSlovakSloveneSouth AfricanSouth AmericanSpaniardSpanishSpanish AmericanSpanish American IndianSri LankanSubsaharan AfricanSwedishSwissSyrianThaiTrinidadian and TobagonianTurkishUgandanUkrainianVenezuelanWelshWest IndianYugoslavian
Immigrant Origin (Total)
Immigrant Origin (Percentage)
Income
Income (Families)
Income (Households)
Poverty
Poverty (Families)
Unemployment
Employment Occupations
Employment Industries
Employer Class
Commute Time
Commute Means
School Enrollment
Education by Degree Field
Occupancy
Finances
Physical Characteristics
Wichita
Compare Zip Codes
Comparison Subject

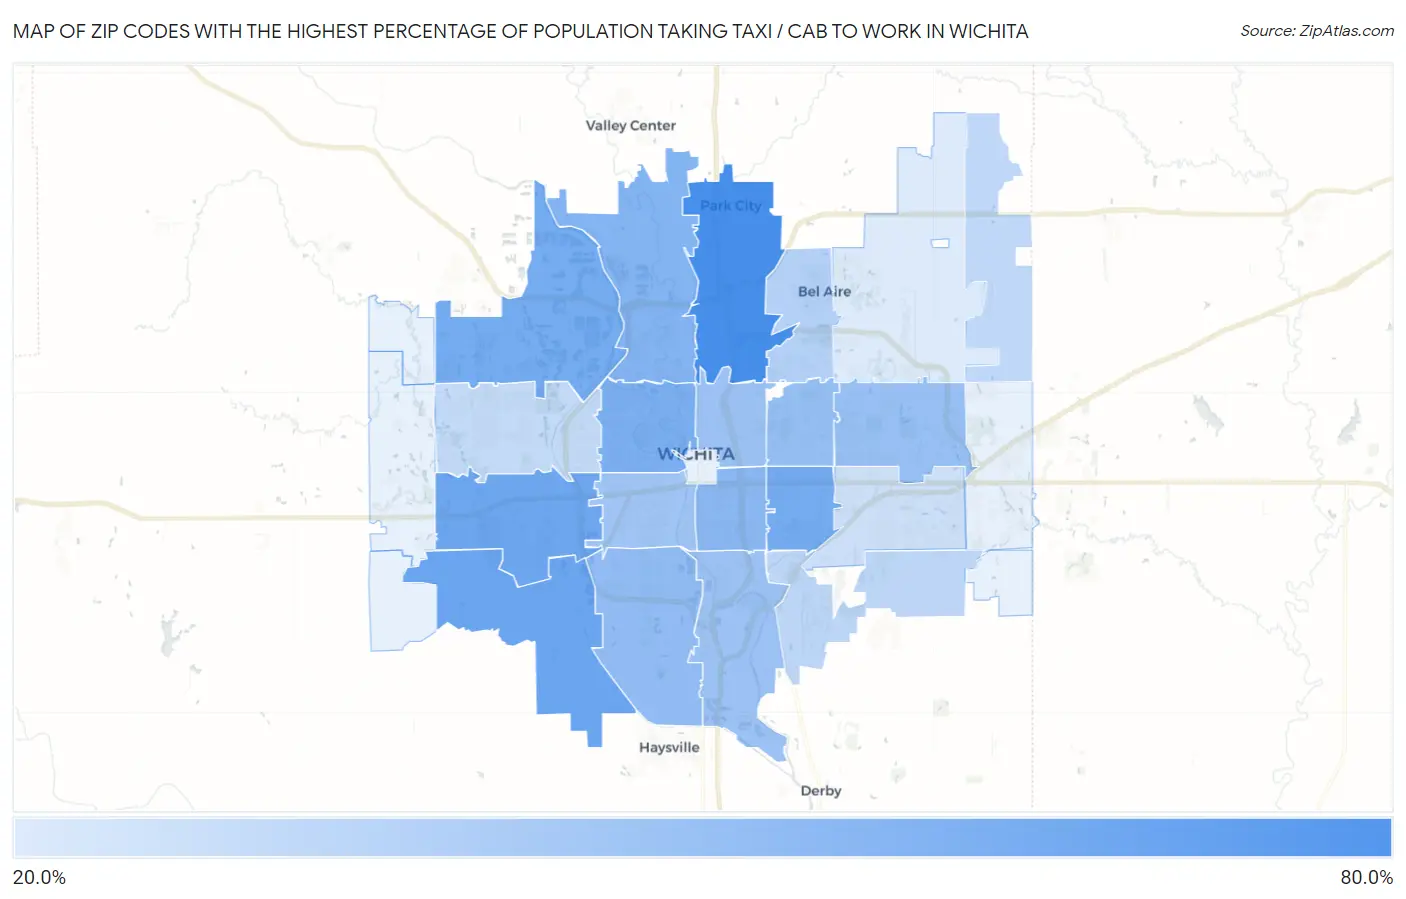
Map of Zip Codes with the Highest Percentage of Population Taking Taxi / Cab to Work in Wichita

0.0%
80.0%
Zip Codes with the Highest Percentage of Population Taking Taxi / Cab to Work in Wichita Map

Zip Codes with the Highest Percentage of Population Taking Taxi / Cab to Work in Wichita, KS

Zip Code % Take Taxi / Cab vs State vs National
1.6721968.1%39.2%(+28.9)#638.2%(+29.9)#124
2.6721555.1%39.2%(+15.9)#3338.2%(+16.9)#1,589
3.6720954.2%39.2%(+15.0)#3738.2%(+16.0)#1,798
4.6720552.5%39.2%(+13.3)#4338.2%(+14.3)#2,232
5.6721852.3%39.2%(+13.1)#4538.2%(+14.1)#2,293
6.6720350.1%39.2%(+10.9)#5338.2%(+11.9)#2,944
7.6720447.7%39.2%(+8.50)#5838.2%(+9.50)#3,718
8.6721145.3%39.2%(+6.10)#6938.2%(+7.10)#4,553
9.6721743.1%39.2%(+3.90)#8138.2%(+4.90)#5,314
10.6720841.8%39.2%(+2.60)#8738.2%(+3.60)#5,812
11.6720641.1%39.2%(+1.90)#8938.2%(+2.90)#6,123
12.6721639.8%39.2%(+0.600)#9538.2%(+1.60)#6,702
13.6721439.8%39.2%(+0.600)#9638.2%(+1.60)#6,707
14.6721338.6%39.2%(-0.600)#10338.2%(+0.400)#7,227
15.6722033.0%39.2%(-6.20)#13038.2%(-5.20)#9,761
16.6721030.4%39.2%(-8.80)#13638.2%(-7.80)#10,807
17.6722829.8%39.2%(-9.40)#13838.2%(-8.40)#11,008
18.6721228.8%39.2%(-10.4)#14438.2%(-9.40)#11,311
19.6720726.1%39.2%(-13.1)#15438.2%(-12.1)#12,006
20.6722621.8%39.2%(-17.4)#16838.2%(-16.4)#12,796

Common Questions

What are the Top 10 Zip Codes with the Highest Percentage of Population Taking Taxi / Cab to Work in Wichita, KS?
Top 10 Zip Codes with the Highest Percentage of Population Taking Taxi / Cab to Work in Wichita, KS are:
#1
68.1%
#2
55.1%
#3
54.2%
#4
52.5%
#5
52.3%
#6
50.1%
#7
47.7%
#8
45.3%
#9
43.1%
#10
41.8%
What zip code has the Highest Percentage of Population Taking Taxi / Cab to Work in Wichita, KS?
67219 has the Highest Percentage of Population Taking Taxi / Cab to Work in Wichita, KS with 68.1%.
What is the Percentage of Population Taking Taxi / Cab to Work in Wichita, KS?
Percentage of Population Taking Taxi / Cab to Work in Wichita is 38.7%.
What is the Percentage of Population Taking Taxi / Cab to Work in Kansas?
Percentage of Population Taking Taxi / Cab to Work in Kansas is 39.2%.
What is the Percentage of Population Taking Taxi / Cab to Work in the United States?
Percentage of Population Taking Taxi / Cab to Work in the United States is 38.2%.