Zip Codes with the Highest Percentage of Population Working from Home in Wichita, KS

RELATED REPORTS & OPTIONS

Work from Home
Population
Families and Households
Female Fertility
Female Fertility (Unmarried)
Race (Community Size)
Race (Percentage)
Ancestry (Community Size)
AfricanAlaska NativeAmericanApacheArabArapahoArgentineanArmenianAustralianAustrianBangladeshiBarbadianBelgianBhutaneseBlackfeetBolivianBrazilianBritishBulgarianBurmeseCajunCanadianCelticCentral AmericanCentral American IndianCherokeeCheyenneChickasawChileanChippewaChoctawColombianComancheCosta RicanCreekCroatianCubanCzechCzechoslovakianDanishDelawareDominicanDutchDutch West IndianEastern EuropeanEcuadorianEgyptianEnglishEthiopianEuropeanFilipinoFinnishFrenchFrench American IndianFrench CanadianGermanGerman RussianGhanaianGreekGuamanian / ChamorroGuatemalanHaitianHonduranHungarianIcelanderIndian (Asian)IndonesianInupiatIranianIrishIroquoisItalianJamaicanJapaneseJordanianKenyanKiowaKoreanLaotianLebaneseLithuanianLuxembourgerMalaysianMexicanMexican American IndianMongolianMoroccanNative HawaiianNavajoNicaraguanNigerianNorthern EuropeanNorwegianOsageOttawaPakistaniPalestinianPanamanianParaguayanPennsylvania GermanPeruvianPimaPolishPortuguesePotawatomiPuebloPuerto RicanRomanianRussianSalvadoranSamoanScandinavianScotch-IrishScottishSeminoleSiouxSlavicSlovakSloveneSouth AfricanSouth AmericanSpaniardSpanishSpanish AmericanSpanish American IndianSri LankanSubsaharan AfricanSwedishSwissSyrianThaiTrinidadian and TobagonianTurkishUgandanUkrainianVenezuelanWelshWest IndianYugoslavian
Ancestry (Percentage)
AfricanAlaska NativeAmericanApacheArabArapahoArgentineanArmenianAustralianAustrianBangladeshiBarbadianBelgianBhutaneseBlackfeetBolivianBrazilianBritishBulgarianBurmeseCajunCanadianCelticCentral AmericanCentral American IndianCherokeeCheyenneChickasawChileanChippewaChoctawColombianComancheCosta RicanCreekCroatianCubanCzechCzechoslovakianDanishDelawareDominicanDutchDutch West IndianEastern EuropeanEcuadorianEgyptianEnglishEthiopianEuropeanFilipinoFinnishFrenchFrench American IndianFrench CanadianGermanGerman RussianGhanaianGreekGuamanian / ChamorroGuatemalanHaitianHonduranHungarianIcelanderIndian (Asian)IndonesianInupiatIranianIrishIroquoisItalianJamaicanJapaneseJordanianKenyanKiowaKoreanLaotianLebaneseLithuanianLuxembourgerMalaysianMexicanMexican American IndianMongolianMoroccanNative HawaiianNavajoNicaraguanNigerianNorthern EuropeanNorwegianOsageOttawaPakistaniPalestinianPanamanianParaguayanPennsylvania GermanPeruvianPimaPolishPortuguesePotawatomiPuebloPuerto RicanRomanianRussianSalvadoranSamoanScandinavianScotch-IrishScottishSeminoleSiouxSlavicSlovakSloveneSouth AfricanSouth AmericanSpaniardSpanishSpanish AmericanSpanish American IndianSri LankanSubsaharan AfricanSwedishSwissSyrianThaiTrinidadian and TobagonianTurkishUgandanUkrainianVenezuelanWelshWest IndianYugoslavian
Immigrant Origin (Total)
Immigrant Origin (Percentage)
Income
Income (Families)
Income (Households)
Poverty
Poverty (Families)
Unemployment
Employment Occupations
Employment Industries
Employer Class
Commute Time
Commute Means
School Enrollment
Education by Degree Field
Occupancy
Finances
Physical Characteristics
Wichita
Compare Zip Codes
Comparison Subject

Map of Zip Codes with the Highest Percentage of Population Working from Home in Wichita

25.9%
59.0%
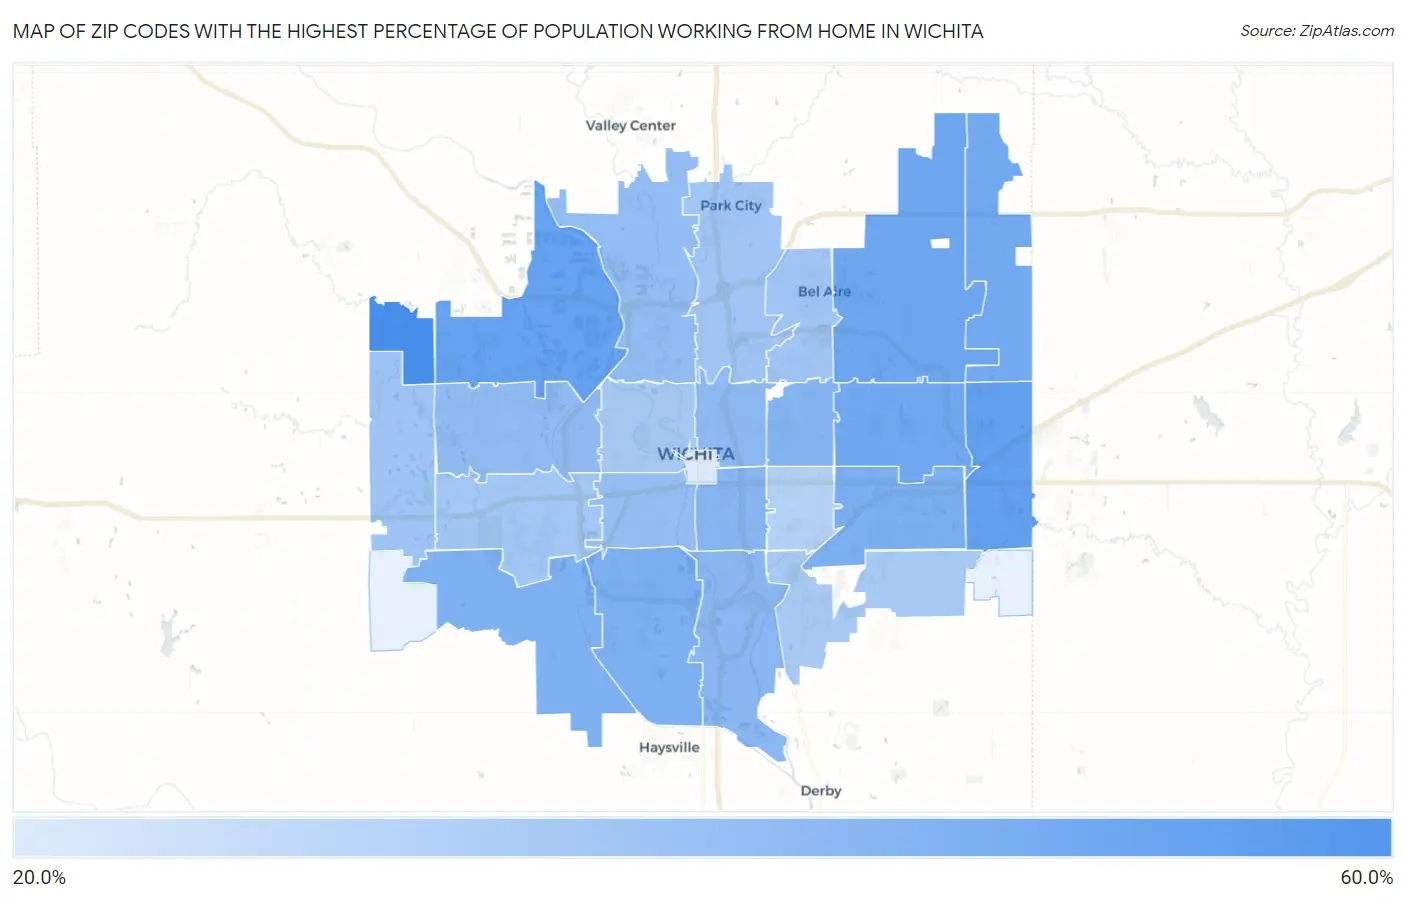
Zip Codes with the Highest Percentage of Population Working from Home in Wichita Map

Zip Codes with the Highest Percentage of Population Working from Home in Wichita, KS

Zip Code % Work from Home vs State vs National
1. 67223 59.0% 44.4% (+14.6)#74 44.0% (+15.0)#2,408
2. 67230 52.1% 44.4% (+7.70)#171 44.0% (+8.10)#6,613
3. 67205 52.0% 44.4% (+7.60)#172 44.0% (+8.00)#6,676
4. 67226 49.4% 44.4% (+5.00)#216 44.0% (+5.40)#9,223
5. 67206 49.0% 44.4% (+4.60)#222 44.0% (+5.00)#9,648
6. 67228 48.6% 44.4% (+4.20)#229 44.0% (+4.60)#10,145
7. 67207 46.5% 44.4% (+2.10)#278 44.0% (+2.50)#12,552
8. 67217 46.3% 44.4% (+1.90)#284 44.0% (+2.30)#12,815
9. 67215 45.8% 44.4% (+1.40)#290 44.0% (+1.80)#13,388
10. 67208 44.5% 44.4% (+0.100)#318 44.0% (+0.500)#14,960
11. 67211 43.9% 44.4% (-0.500)#328 44.0% (-0.100)#15,633
12. 67216 43.3% 44.4% (-1.10)#342 44.0% (-0.700)#16,335
13. 67214 42.3% 44.4% (-2.10)#370 44.0% (-1.70)#17,446
14. 67212 41.5% 44.4% (-2.90)#380 44.0% (-2.50)#18,204
15. 67204 41.3% 44.4% (-3.10)#384 44.0% (-2.70)#18,445
16. 67213 40.9% 44.4% (-3.50)#386 44.0% (-3.10)#18,799
17. 67235 38.9% 44.4% (-5.50)#413 44.0% (-5.10)#20,470
18. 67220 38.4% 44.4% (-6.00)#423 44.0% (-5.60)#20,838
19. 67219 38.2% 44.4% (-6.20)#424 44.0% (-5.80)#20,954
20. 67209 37.8% 44.4% (-6.60)#426 44.0% (-6.20)#21,198
21. 67210 36.9% 44.4% (-7.50)#436 44.0% (-7.10)#21,713
22. 67203 36.7% 44.4% (-7.70)#440 44.0% (-7.30)#21,831
23. 67218 33.6% 44.4% (-10.8)#460 44.0% (-10.4)#23,126
24. 67202 25.9% 44.4% (-18.5)#489 44.0% (-18.1)#24,293

Common Questions

What are the Top 10 Zip Codes with the Highest Percentage of Population Working from Home in Wichita, KS?
Top 10 Zip Codes with the Highest Percentage of Population Working from Home in Wichita, KS are:
#1
59.0%
#2
52.1%
#3
52.0%
#4
49.4%
#5
49.0%
#6
48.6%
#7
46.5%
#8
46.3%
#9
45.8%
#10
44.5%
What zip code has the Highest Percentage of Population Working from Home in Wichita, KS?
67223 has the Highest Percentage of Population Working from Home in Wichita, KS with 59.0%.
What is the Percentage of Population Working from Home in Wichita, KS?
Percentage of Population Working from Home in Wichita is 42.7%.
What is the Percentage of Population Working from Home in Kansas?
Percentage of Population Working from Home in Kansas is 44.4%.
What is the Percentage of Population Working from Home in the United States?
Percentage of Population Working from Home in the United States is 44.0%.