Zip Codes with the Highest Percentage of Population Employed in Education Instruction & Library in Wichita, KS
RELATED REPORTS & OPTIONS
Education Instruction & Library
Wichita
Compare Zip Codes
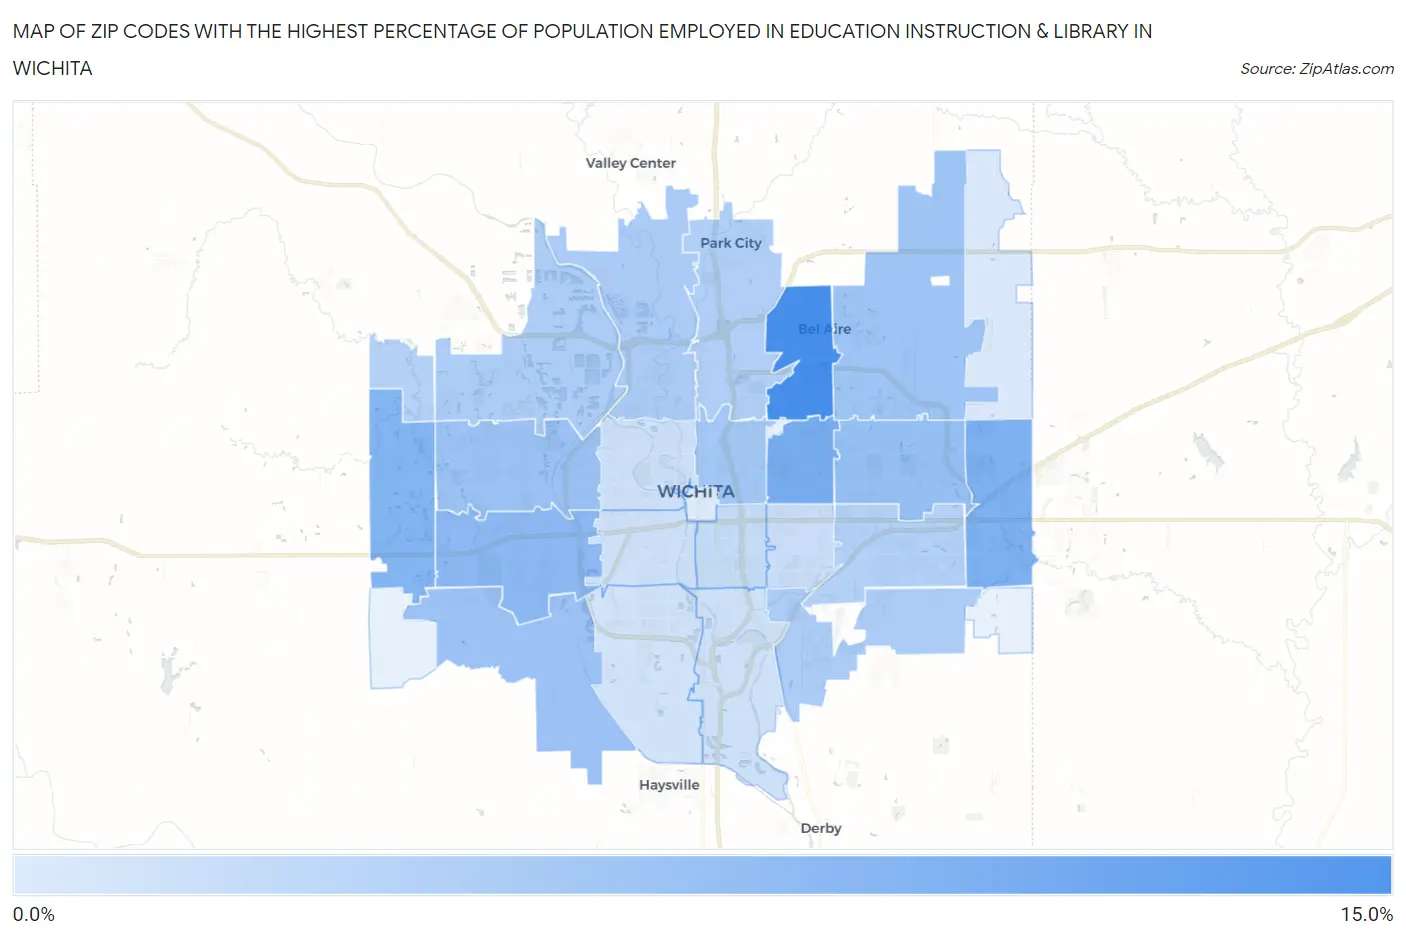
Map of Zip Codes with the Highest Percentage of Population Employed in Education Instruction & Library in Wichita
2.9%
13.1%
Zip Codes with the Highest Percentage of Population Employed in Education Instruction & Library in Wichita, KS
| Zip Code | % Employed | vs State | vs National | |
| 1. | 67220 | 13.1% | 7.0%(+6.08)#62 | 6.2%(+6.88)#1,876 |
| 2. | 67208 | 9.7% | 7.0%(+2.67)#151 | 6.2%(+3.47)#4,329 |
| 3. | 67230 | 9.3% | 7.0%(+2.29)#162 | 6.2%(+3.09)#4,839 |
| 4. | 67235 | 8.9% | 7.0%(+1.94)#183 | 6.2%(+2.74)#5,357 |
| 5. | 67209 | 8.3% | 7.0%(+1.35)#219 | 6.2%(+2.15)#6,433 |
| 6. | 67206 | 7.7% | 7.0%(+0.667)#269 | 6.2%(+1.47)#8,036 |
| 7. | 67212 | 7.4% | 7.0%(+0.423)#287 | 6.2%(+1.23)#8,680 |
| 8. | 67215 | 7.1% | 7.0%(+0.146)#296 | 6.2%(+0.948)#9,486 |
| 9. | 67226 | 7.0% | 7.0%(+0.011)#307 | 6.2%(+0.814)#9,913 |
| 10. | 67214 | 6.7% | 7.0%(-0.291)#320 | 6.2%(+0.512)#10,914 |
| 11. | 67204 | 6.3% | 7.0%(-0.704)#345 | 6.2%(+0.099)#12,427 |
| 12. | 67210 | 6.1% | 7.0%(-0.860)#357 | 6.2%(-0.058)#13,031 |
| 13. | 67205 | 6.0% | 7.0%(-0.949)#364 | 6.2%(-0.147)#13,348 |
| 14. | 67219 | 5.8% | 7.0%(-1.15)#376 | 6.2%(-0.349)#14,171 |
| 15. | 67207 | 5.7% | 7.0%(-1.32)#395 | 6.2%(-0.514)#14,880 |
| 16. | 67223 | 5.4% | 7.0%(-1.54)#409 | 6.2%(-0.739)#15,784 |
| 17. | 67211 | 4.5% | 7.0%(-2.48)#479 | 6.2%(-1.68)#19,698 |
| 18. | 67218 | 4.1% | 7.0%(-2.84)#498 | 6.2%(-2.04)#21,127 |
| 19. | 67203 | 3.9% | 7.0%(-3.08)#515 | 6.2%(-2.28)#22,016 |
| 20. | 67213 | 3.8% | 7.0%(-3.18)#521 | 6.2%(-2.37)#22,366 |
| 21. | 67216 | 3.8% | 7.0%(-3.19)#523 | 6.2%(-2.38)#22,390 |
| 22. | 67217 | 3.6% | 7.0%(-3.36)#539 | 6.2%(-2.56)#22,957 |
| 23. | 67228 | 3.0% | 7.0%(-3.97)#562 | 6.2%(-3.17)#24,820 |
| 24. | 67202 | 2.9% | 7.0%(-4.05)#565 | 6.2%(-3.25)#24,972 |
1
Common Questions
What are the Top 10 Zip Codes with the Highest Percentage of Population Employed in Education Instruction & Library in Wichita, KS?
Top 10 Zip Codes with the Highest Percentage of Population Employed in Education Instruction & Library in Wichita, KS are:
What zip code has the Highest Percentage of Population Employed in Education Instruction & Library in Wichita, KS?
67220 has the Highest Percentage of Population Employed in Education Instruction & Library in Wichita, KS with 13.1%.
What is the Percentage of Population Employed in Education Instruction & Library in Wichita, KS?
Percentage of Population Employed in Education Instruction & Library in Wichita is 6.2%.
What is the Percentage of Population Employed in Education Instruction & Library in Kansas?
Percentage of Population Employed in Education Instruction & Library in Kansas is 7.0%.
What is the Percentage of Population Employed in Education Instruction & Library in the United States?
Percentage of Population Employed in Education Instruction & Library in the United States is 6.2%.