Zip Codes with the Highest Percentage of Households Heated by Bottled Gas / Liquid Propane in Wichita, KS
RELATED REPORTS & OPTIONS
Bottled Gas / LP Heating
Wichita
Compare Zip Codes
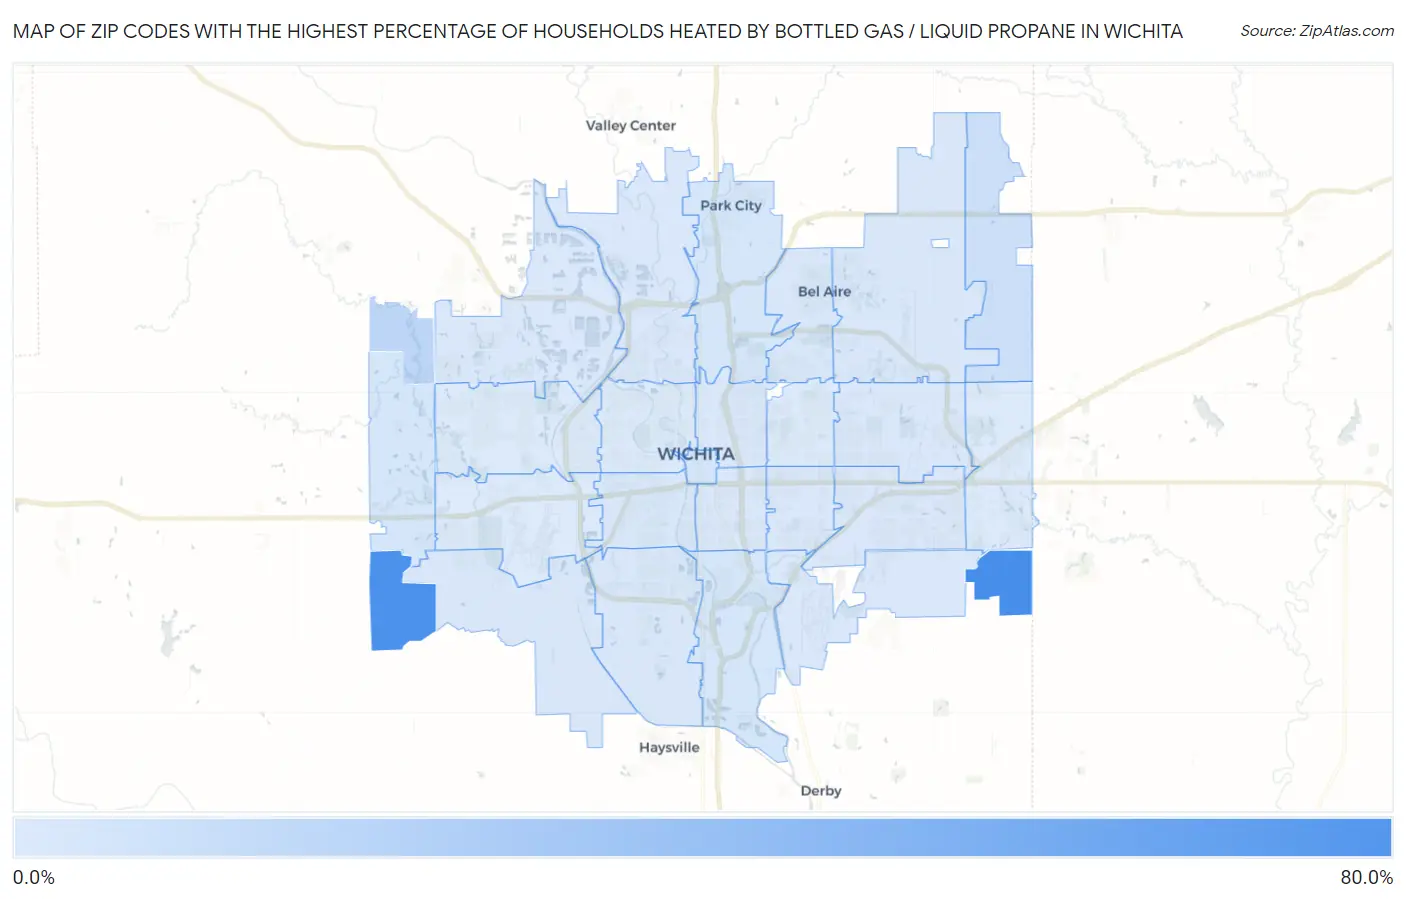
Map of Zip Codes with the Highest Percentage of Households Heated by Bottled Gas / Liquid Propane in Wichita
0.40%
70.0%
Zip Codes with the Highest Percentage of Households Heated by Bottled Gas / Liquid Propane in Wichita, KS
| Zip Code | Bottled Gas / LP Heating | vs State | vs National | |
| 1. | 67232 | 70.0% | 7.8%(+62.2)#41 | 4.9%(+65.1)#731 |
| 2. | 67227 | 67.5% | 7.8%(+59.7)#50 | 4.9%(+62.6)#856 |
| 3. | 67223 | 12.9% | 7.8%(+5.10)#444 | 4.9%(+8.00)#12,502 |
| 4. | 67228 | 6.2% | 7.8%(-1.60)#551 | 4.9%(+1.30)#17,438 |
| 5. | 67216 | 3.0% | 7.8%(-4.80)#591 | 4.9%(-1.90)#21,029 |
| 6. | 67219 | 3.0% | 7.8%(-4.80)#593 | 4.9%(-1.90)#21,071 |
| 7. | 67235 | 2.9% | 7.8%(-4.90)#594 | 4.9%(-2.00)#21,232 |
| 8. | 67202 | 2.5% | 7.8%(-5.30)#604 | 4.9%(-2.40)#22,072 |
| 9. | 67217 | 2.1% | 7.8%(-5.70)#614 | 4.9%(-2.80)#22,869 |
| 10. | 67220 | 2.0% | 7.8%(-5.80)#620 | 4.9%(-2.90)#23,256 |
| 11. | 67215 | 1.9% | 7.8%(-5.90)#623 | 4.9%(-3.00)#23,590 |
| 12. | 67213 | 1.8% | 7.8%(-6.00)#624 | 4.9%(-3.10)#23,783 |
| 13. | 67226 | 1.7% | 7.8%(-6.10)#629 | 4.9%(-3.20)#24,083 |
| 14. | 67214 | 1.6% | 7.8%(-6.20)#635 | 4.9%(-3.30)#24,470 |
| 15. | 67210 | 1.6% | 7.8%(-6.20)#636 | 4.9%(-3.30)#24,509 |
| 16. | 67204 | 1.5% | 7.8%(-6.30)#638 | 4.9%(-3.40)#24,777 |
| 17. | 67207 | 1.4% | 7.8%(-6.40)#641 | 4.9%(-3.50)#25,117 |
| 18. | 67218 | 1.3% | 7.8%(-6.50)#644 | 4.9%(-3.60)#25,534 |
| 19. | 67211 | 1.2% | 7.8%(-6.60)#646 | 4.9%(-3.70)#25,965 |
| 20. | 67205 | 0.90% | 7.8%(-6.90)#657 | 4.9%(-4.00)#27,174 |
| 21. | 67206 | 0.90% | 7.8%(-6.90)#658 | 4.9%(-4.00)#27,194 |
| 22. | 67203 | 0.80% | 7.8%(-7.00)#663 | 4.9%(-4.10)#27,485 |
| 23. | 67208 | 0.80% | 7.8%(-7.00)#664 | 4.9%(-4.10)#27,591 |
| 24. | 67212 | 0.60% | 7.8%(-7.20)#666 | 4.9%(-4.30)#28,154 |
| 25. | 67230 | 0.50% | 7.8%(-7.30)#669 | 4.9%(-4.40)#28,717 |
| 26. | 67209 | 0.40% | 7.8%(-7.40)#671 | 4.9%(-4.50)#29,006 |
1
Common Questions
What are the Top 10 Zip Codes with the Highest Percentage of Households Heated by Bottled Gas / Liquid Propane in Wichita, KS?
Top 10 Zip Codes with the Highest Percentage of Households Heated by Bottled Gas / Liquid Propane in Wichita, KS are:
What zip code has the Highest Percentage of Households Heated by Bottled Gas / Liquid Propane in Wichita, KS?
67232 has the Highest Percentage of Households Heated by Bottled Gas / Liquid Propane in Wichita, KS with 70.0%.
What is the Percentage of Households Heated by Bottled Gas / Liquid Propane in Wichita, KS?
Percentage of Households Heated by Bottled Gas / Liquid Propane in Wichita is 1.3%.
What is the Percentage of Households Heated by Bottled Gas / Liquid Propane in Kansas?
Percentage of Households Heated by Bottled Gas / Liquid Propane in Kansas is 7.8%.
What is the Percentage of Households Heated by Bottled Gas / Liquid Propane in the United States?
Percentage of Households Heated by Bottled Gas / Liquid Propane in the United States is 4.9%.