Zip Codes with the Highest Percentage of Households with Income Above $200,000 in Wichita, KS
RELATED REPORTS & OPTIONS
Household Income | $200k+
Wichita
Compare Zip Codes
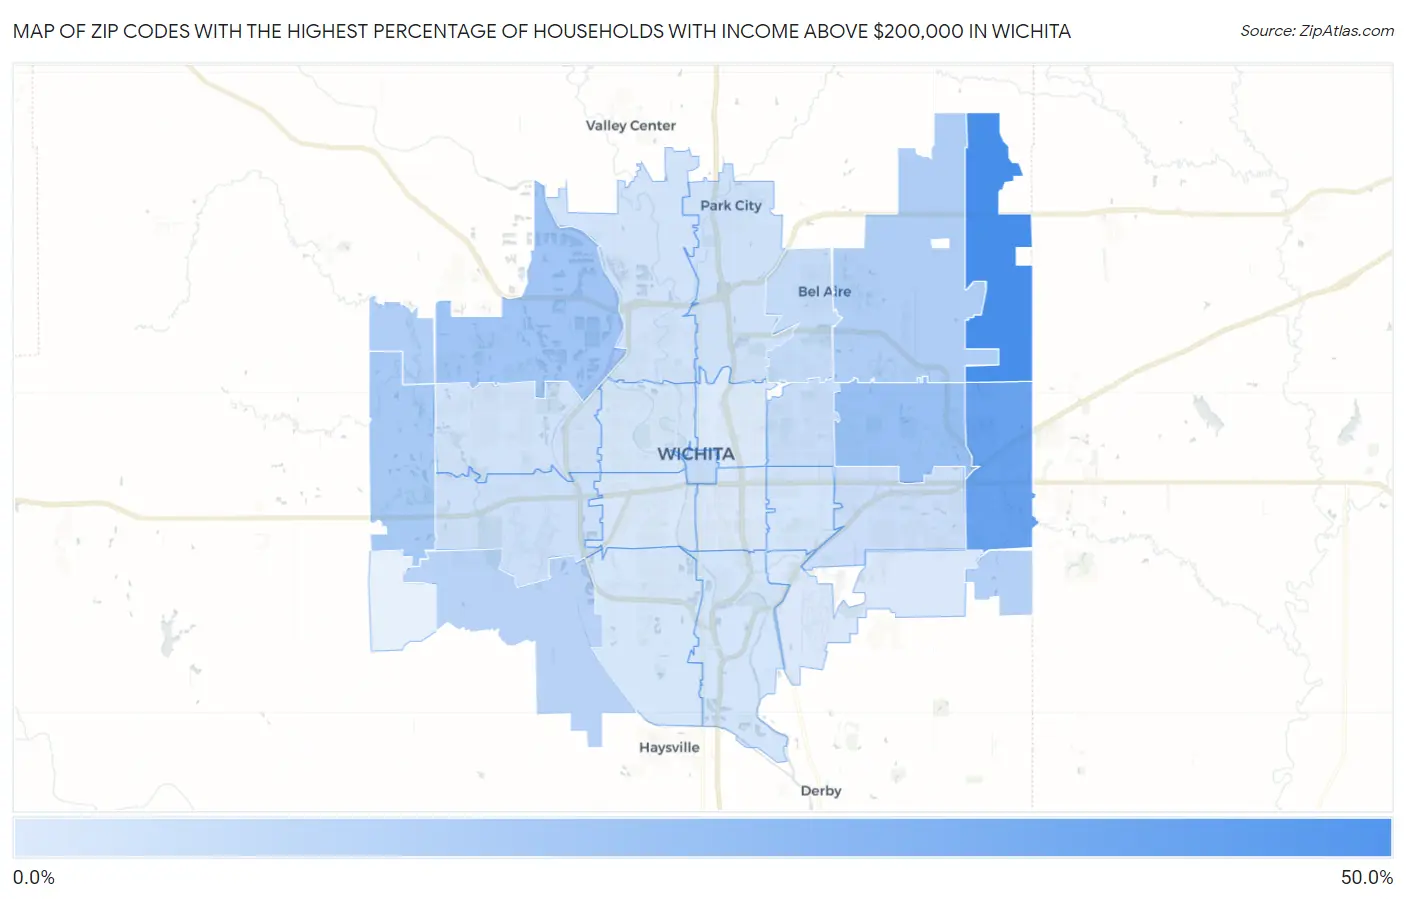
Map of Zip Codes with the Highest Percentage of Households with Income Above $200,000 in Wichita
0.10%
46.7%
Zip Codes with the Highest Percentage of Households with Income Above $200,000 in Wichita, KS
| Zip Code | Households with Income > $200k | vs State | vs National | |
| 1. | 67228 | 46.7% | 8.0%(+38.7)#3 | 11.4%(+35.3)#366 |
| 2. | 67230 | 34.8% | 8.0%(+26.8)#6 | 11.4%(+23.4)#999 |
| 3. | 67206 | 19.1% | 8.0%(+11.1)#33 | 11.4%(+7.70)#3,545 |
| 4. | 67205 | 16.7% | 8.0%(+8.70)#43 | 11.4%(+5.30)#4,290 |
| 5. | 67235 | 14.5% | 8.0%(+6.50)#53 | 11.4%(+3.10)#5,224 |
| 6. | 67226 | 12.4% | 8.0%(+4.40)#63 | 11.4%(+1.000)#6,407 |
| 7. | 67223 | 11.9% | 8.0%(+3.90)#70 | 11.4%(+0.500)#6,773 |
| 8. | 67232 | 11.4% | 8.0%(+3.40)#77 | 11.4%(=0.000)#7,130 |
| 9. | 67215 | 9.8% | 8.0%(+1.80)#99 | 11.4%(-1.60)#8,477 |
| 10. | 67220 | 6.8% | 8.0%(-1.20)#163 | 11.4%(-4.60)#12,094 |
| 11. | 67202 | 6.0% | 8.0%(-2.00)#199 | 11.4%(-5.40)#13,550 |
| 12. | 67208 | 5.6% | 8.0%(-2.40)#217 | 11.4%(-5.80)#14,298 |
| 13. | 67207 | 5.2% | 8.0%(-2.80)#241 | 11.4%(-6.20)#15,098 |
| 14. | 67209 | 4.6% | 8.0%(-3.40)#271 | 11.4%(-6.80)#16,563 |
| 15. | 67219 | 3.7% | 8.0%(-4.30)#332 | 11.4%(-7.70)#18,918 |
| 16. | 67212 | 3.2% | 8.0%(-4.80)#363 | 11.4%(-8.20)#20,276 |
| 17. | 67204 | 2.9% | 8.0%(-5.10)#384 | 11.4%(-8.50)#21,164 |
| 18. | 67218 | 2.7% | 8.0%(-5.30)#390 | 11.4%(-8.70)#21,741 |
| 19. | 67216 | 2.7% | 8.0%(-5.30)#391 | 11.4%(-8.70)#21,743 |
| 20. | 67203 | 1.9% | 8.0%(-6.10)#444 | 11.4%(-9.50)#24,044 |
| 21. | 67217 | 1.6% | 8.0%(-6.40)#466 | 11.4%(-9.80)#24,806 |
| 22. | 67213 | 1.1% | 8.0%(-6.90)#500 | 11.4%(-10.3)#25,958 |
| 23. | 67211 | 0.70% | 8.0%(-7.30)#526 | 11.4%(-10.7)#26,737 |
| 24. | 67210 | 0.50% | 8.0%(-7.50)#535 | 11.4%(-10.9)#27,097 |
| 25. | 67214 | 0.10% | 8.0%(-7.90)#553 | 11.4%(-11.3)#27,542 |
1
Common Questions
What are the Top 10 Zip Codes with the Highest Percentage of Households with Income Above $200,000 in Wichita, KS?
Top 10 Zip Codes with the Highest Percentage of Households with Income Above $200,000 in Wichita, KS are:
What zip code has the Highest Percentage of Households with Income Above $200,000 in Wichita, KS?
67228 has the Highest Percentage of Households with Income Above $200,000 in Wichita, KS with 46.7%.
What is the Percentage of Households with Income Above $200,000 in Wichita, KS?
Percentage of Households with Income Above $200,000 in Wichita is 6.0%.
What is the Percentage of Households with Income Above $200,000 in Kansas?
Percentage of Households with Income Above $200,000 in Kansas is 8.0%.
What is the Percentage of Households with Income Above $200,000 in the United States?
Percentage of Households with Income Above $200,000 in the United States is 11.4%.