Zip Codes with the Highest Percentage of Population Employed in Agriculture, Fishing & Hunting in Wichita, KS
RELATED REPORTS & OPTIONS
Agriculture, Fishing & Hunting
Wichita
Compare Zip Codes
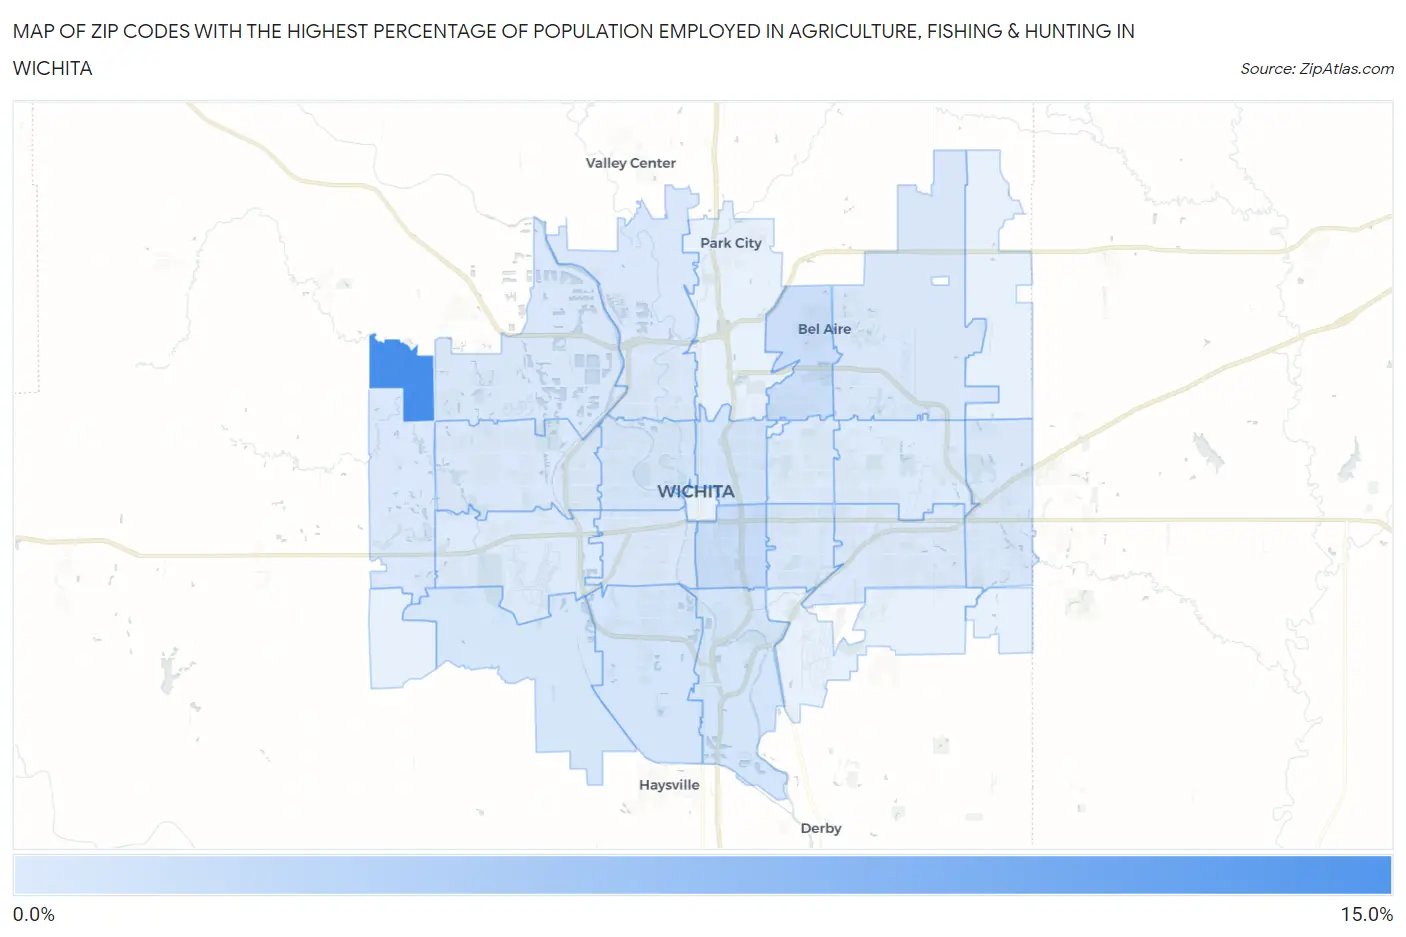
Map of Zip Codes with the Highest Percentage of Population Employed in Agriculture, Fishing & Hunting in Wichita
0.12%
13.2%
Zip Codes with the Highest Percentage of Population Employed in Agriculture, Fishing & Hunting in Wichita, KS
| Zip Code | % Employed | vs State | vs National | |
| 1. | 67223 | 13.2% | 2.6%(+10.6)#201 | 1.2%(+12.0)#3,115 |
| 2. | 67211 | 1.8% | 2.6%(-0.819)#487 | 1.2%(+0.568)#13,438 |
| 3. | 67220 | 1.7% | 2.6%(-0.911)#490 | 1.2%(+0.477)#13,725 |
| 4. | 67214 | 0.95% | 2.6%(-1.63)#533 | 1.2%(-0.247)#16,443 |
| 5. | 67216 | 0.92% | 2.6%(-1.67)#537 | 1.2%(-0.280)#16,617 |
| 6. | 67217 | 0.80% | 2.6%(-1.79)#548 | 1.2%(-0.398)#17,233 |
| 7. | 67203 | 0.71% | 2.6%(-1.87)#554 | 1.2%(-0.485)#17,764 |
| 8. | 67215 | 0.65% | 2.6%(-1.94)#559 | 1.2%(-0.554)#18,165 |
| 9. | 67205 | 0.56% | 2.6%(-2.03)#564 | 1.2%(-0.638)#18,759 |
| 10. | 67230 | 0.49% | 2.6%(-2.09)#570 | 1.2%(-0.705)#19,332 |
| 11. | 67226 | 0.49% | 2.6%(-2.09)#571 | 1.2%(-0.706)#19,344 |
| 12. | 67218 | 0.46% | 2.6%(-2.13)#576 | 1.2%(-0.742)#19,638 |
| 13. | 67235 | 0.40% | 2.6%(-2.18)#584 | 1.2%(-0.797)#20,135 |
| 14. | 67204 | 0.36% | 2.6%(-2.23)#591 | 1.2%(-0.842)#20,579 |
| 15. | 67207 | 0.30% | 2.6%(-2.29)#598 | 1.2%(-0.899)#21,169 |
| 16. | 67213 | 0.27% | 2.6%(-2.32)#601 | 1.2%(-0.932)#21,569 |
| 17. | 67212 | 0.22% | 2.6%(-2.37)#607 | 1.2%(-0.980)#22,109 |
| 18. | 67209 | 0.14% | 2.6%(-2.44)#614 | 1.2%(-1.06)#23,135 |
| 19. | 67206 | 0.13% | 2.6%(-2.46)#617 | 1.2%(-1.07)#23,317 |
| 20. | 67208 | 0.12% | 2.6%(-2.47)#619 | 1.2%(-1.08)#23,413 |
1
Common Questions
What are the Top 10 Zip Codes with the Highest Percentage of Population Employed in Agriculture, Fishing & Hunting in Wichita, KS?
Top 10 Zip Codes with the Highest Percentage of Population Employed in Agriculture, Fishing & Hunting in Wichita, KS are:
What zip code has the Highest Percentage of Population Employed in Agriculture, Fishing & Hunting in Wichita, KS?
67223 has the Highest Percentage of Population Employed in Agriculture, Fishing & Hunting in Wichita, KS with 13.2%.
What is the Percentage of Population Employed in Agriculture, Fishing & Hunting in Wichita, KS?
Percentage of Population Employed in Agriculture, Fishing & Hunting in Wichita is 0.55%.
What is the Percentage of Population Employed in Agriculture, Fishing & Hunting in Kansas?
Percentage of Population Employed in Agriculture, Fishing & Hunting in Kansas is 2.6%.
What is the Percentage of Population Employed in Agriculture, Fishing & Hunting in the United States?
Percentage of Population Employed in Agriculture, Fishing & Hunting in the United States is 1.2%.