Zip Codes with the Highest Percentage of Scotch-Irish Population in Wichita, KS

RELATED REPORTS & OPTIONS

Scotch-Irish
Population
Families and Households
Female Fertility
Female Fertility (Unmarried)
Race (Community Size)
Race (Percentage)
Ancestry (Community Size)
AfricanAlaska NativeAmericanApacheArabArapahoArgentineanArmenianAustralianAustrianBangladeshiBarbadianBelgianBhutaneseBlackfeetBolivianBrazilianBritishBulgarianBurmeseCajunCanadianCelticCentral AmericanCentral American IndianCherokeeCheyenneChickasawChileanChippewaChoctawColombianComancheCosta RicanCreekCroatianCubanCzechCzechoslovakianDanishDelawareDominicanDutchDutch West IndianEastern EuropeanEcuadorianEgyptianEnglishEthiopianEuropeanFilipinoFinnishFrenchFrench American IndianFrench CanadianGermanGerman RussianGhanaianGreekGuamanian / ChamorroGuatemalanHaitianHonduranHungarianIcelanderIndian (Asian)IndonesianInupiatIranianIrishIroquoisItalianJamaicanJapaneseJordanianKenyanKiowaKoreanLaotianLebaneseLithuanianLuxembourgerMalaysianMexicanMexican American IndianMongolianMoroccanNative HawaiianNavajoNicaraguanNigerianNorthern EuropeanNorwegianOsageOttawaPakistaniPalestinianPanamanianParaguayanPennsylvania GermanPeruvianPimaPolishPortuguesePotawatomiPuebloPuerto RicanRomanianRussianSalvadoranSamoanScandinavianScotch-IrishScottishSeminoleSiouxSlavicSlovakSloveneSouth AfricanSouth AmericanSpaniardSpanishSpanish AmericanSpanish American IndianSri LankanSubsaharan AfricanSwedishSwissSyrianThaiTrinidadian and TobagonianTurkishUgandanUkrainianVenezuelanWelshWest IndianYugoslavian
Ancestry (Percentage)
AfricanAlaska NativeAmericanApacheArabArapahoArgentineanArmenianAustralianAustrianBangladeshiBarbadianBelgianBhutaneseBlackfeetBolivianBrazilianBritishBulgarianBurmeseCajunCanadianCelticCentral AmericanCentral American IndianCherokeeCheyenneChickasawChileanChippewaChoctawColombianComancheCosta RicanCreekCroatianCubanCzechCzechoslovakianDanishDelawareDominicanDutchDutch West IndianEastern EuropeanEcuadorianEgyptianEnglishEthiopianEuropeanFilipinoFinnishFrenchFrench American IndianFrench CanadianGermanGerman RussianGhanaianGreekGuamanian / ChamorroGuatemalanHaitianHonduranHungarianIcelanderIndian (Asian)IndonesianInupiatIranianIrishIroquoisItalianJamaicanJapaneseJordanianKenyanKiowaKoreanLaotianLebaneseLithuanianLuxembourgerMalaysianMexicanMexican American IndianMongolianMoroccanNative HawaiianNavajoNicaraguanNigerianNorthern EuropeanNorwegianOsageOttawaPakistaniPalestinianPanamanianParaguayanPennsylvania GermanPeruvianPimaPolishPortuguesePotawatomiPuebloPuerto RicanRomanianRussianSalvadoranSamoanScandinavianScotch-IrishScottishSeminoleSiouxSlavicSlovakSloveneSouth AfricanSouth AmericanSpaniardSpanishSpanish AmericanSpanish American IndianSri LankanSubsaharan AfricanSwedishSwissSyrianThaiTrinidadian and TobagonianTurkishUgandanUkrainianVenezuelanWelshWest IndianYugoslavian
Immigrant Origin (Total)
Immigrant Origin (Percentage)
Income
Income (Families)
Income (Households)
Poverty
Poverty (Families)
Unemployment
Employment Occupations
Employment Industries
Employer Class
Commute Time
Commute Means
School Enrollment
Education by Degree Field
Occupancy
Finances
Physical Characteristics
Wichita
Compare Zip Codes
Comparison Subject

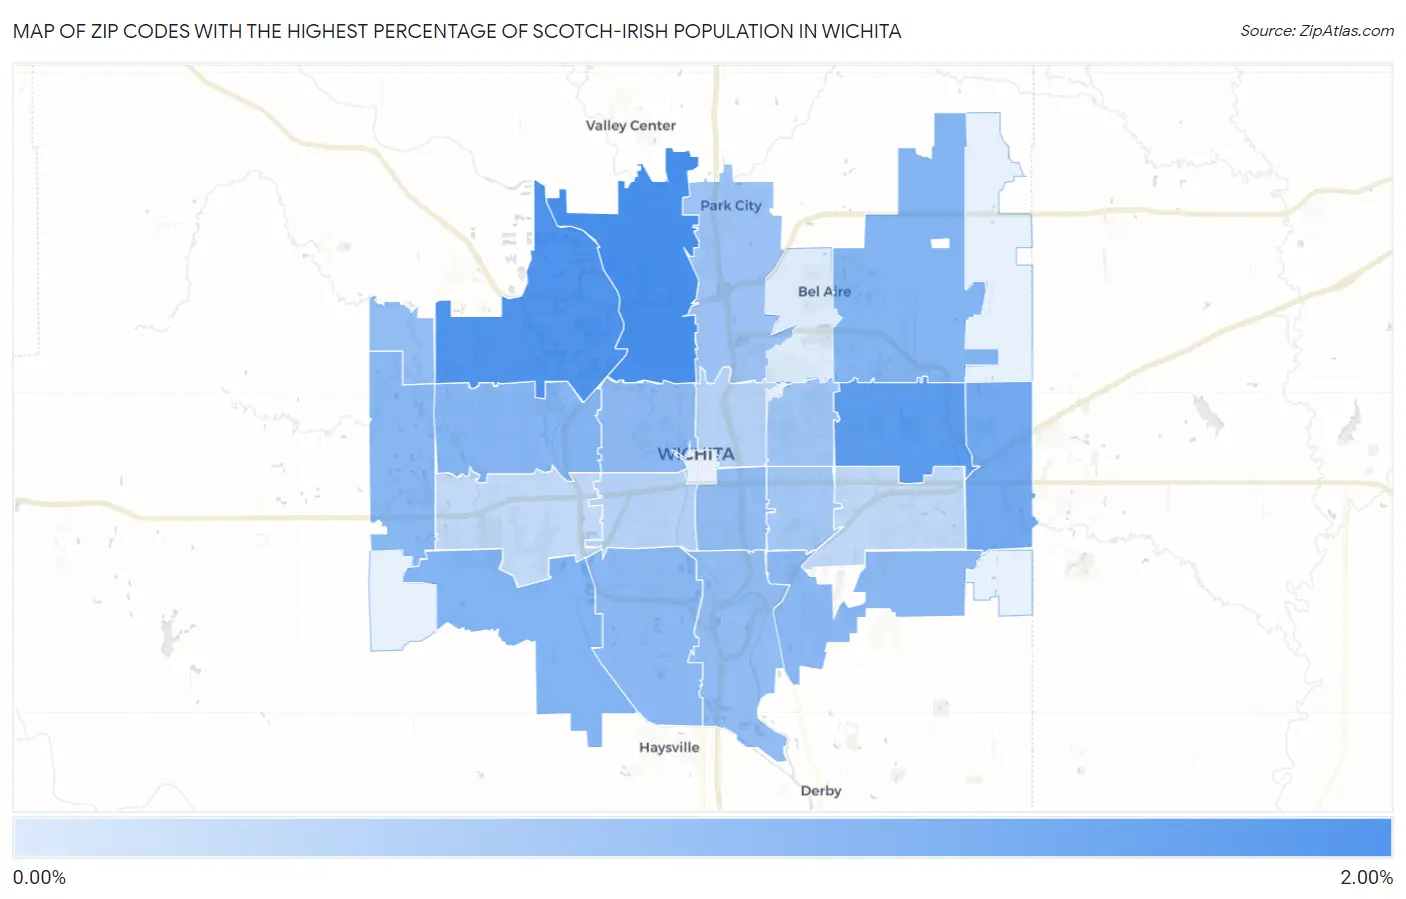
Map of Zip Codes with the Highest Percentage of Scotch-Irish Population in Wichita

0.00%
2.00%
Zip Codes with the Highest Percentage of Scotch-Irish Population in Wichita Map

Zip Codes with the Highest Percentage of Scotch-Irish Population in Wichita, KS

Zip Code Scotch-Irish vs State vs National
1.672041.72%0.90%(+0.820)#980.82%(+0.901)#4,824
2.672051.64%0.90%(+0.745)#1080.82%(+0.826)#5,171
3.672061.51%0.90%(+0.612)#1260.82%(+0.693)#5,864
4.672301.23%0.90%(+0.328)#1710.82%(+0.410)#7,727
5.672151.06%0.90%(+0.160)#2020.82%(+0.241)#9,127
6.672261.04%0.90%(+0.140)#2090.82%(+0.221)#9,331
7.672121.01%0.90%(+0.111)#2180.82%(+0.192)#9,655
8.672351.00%0.90%(+0.098)#2210.82%(+0.180)#9,774
9.672100.97%0.90%(+0.075)#2250.82%(+0.156)#10,030
10.672170.97%0.90%(+0.067)#2270.82%(+0.148)#10,106
11.672030.93%0.90%(+0.033)#2350.82%(+0.114)#10,459
12.672160.89%0.90%(-0.010)#2470.82%(+0.071)#10,955
13.672110.88%0.90%(-0.017)#2490.82%(+0.064)#11,036
14.672230.87%0.90%(-0.031)#2520.82%(+0.051)#11,193
15.672190.78%0.90%(-0.117)#2790.82%(-0.036)#12,293
16.672080.73%0.90%(-0.165)#2940.82%(-0.084)#12,916
17.672180.68%0.90%(-0.216)#3140.82%(-0.134)#13,636
18.672140.48%0.90%(-0.419)#3740.82%(-0.338)#16,752
19.672130.48%0.90%(-0.421)#3750.82%(-0.339)#16,769
20.672070.38%0.90%(-0.520)#4090.82%(-0.439)#18,417
21.672090.36%0.90%(-0.540)#4210.82%(-0.459)#18,736
22.672200.041%0.90%(-0.858)#5110.82%(-0.777)#23,745

Common Questions

What are the Top 10 Zip Codes with the Highest Percentage of Scotch-Irish Population in Wichita, KS?
Top 10 Zip Codes with the Highest Percentage of Scotch-Irish Population in Wichita, KS are:
#1
1.72%
#2
1.64%
#3
1.51%
#4
1.23%
#5
1.06%
#6
1.04%
#7
1.01%
#8
1.00%
#9
0.97%
#10
0.97%
What zip code has the Highest Percentage of Scotch-Irish Population in Wichita, KS?
67204 has the Highest Percentage of Scotch-Irish Population in Wichita, KS with 1.72%.
What is the Percentage of Scotch-Irish Population in Wichita, KS?
Percentage of Scotch-Irish Population in Wichita is 0.87%.
What is the Percentage of Scotch-Irish Population in Kansas?
Percentage of Scotch-Irish Population in Kansas is 0.90%.
What is the Percentage of Scotch-Irish Population in the United States?
Percentage of Scotch-Irish Population in the United States is 0.82%.