Zip Codes with the Highest Percentage of Population with a Degree in Physical and Health Sciences in Wichita, KS
RELATED REPORTS & OPTIONS
Physical and Health Sciences
Wichita
Compare Zip Codes
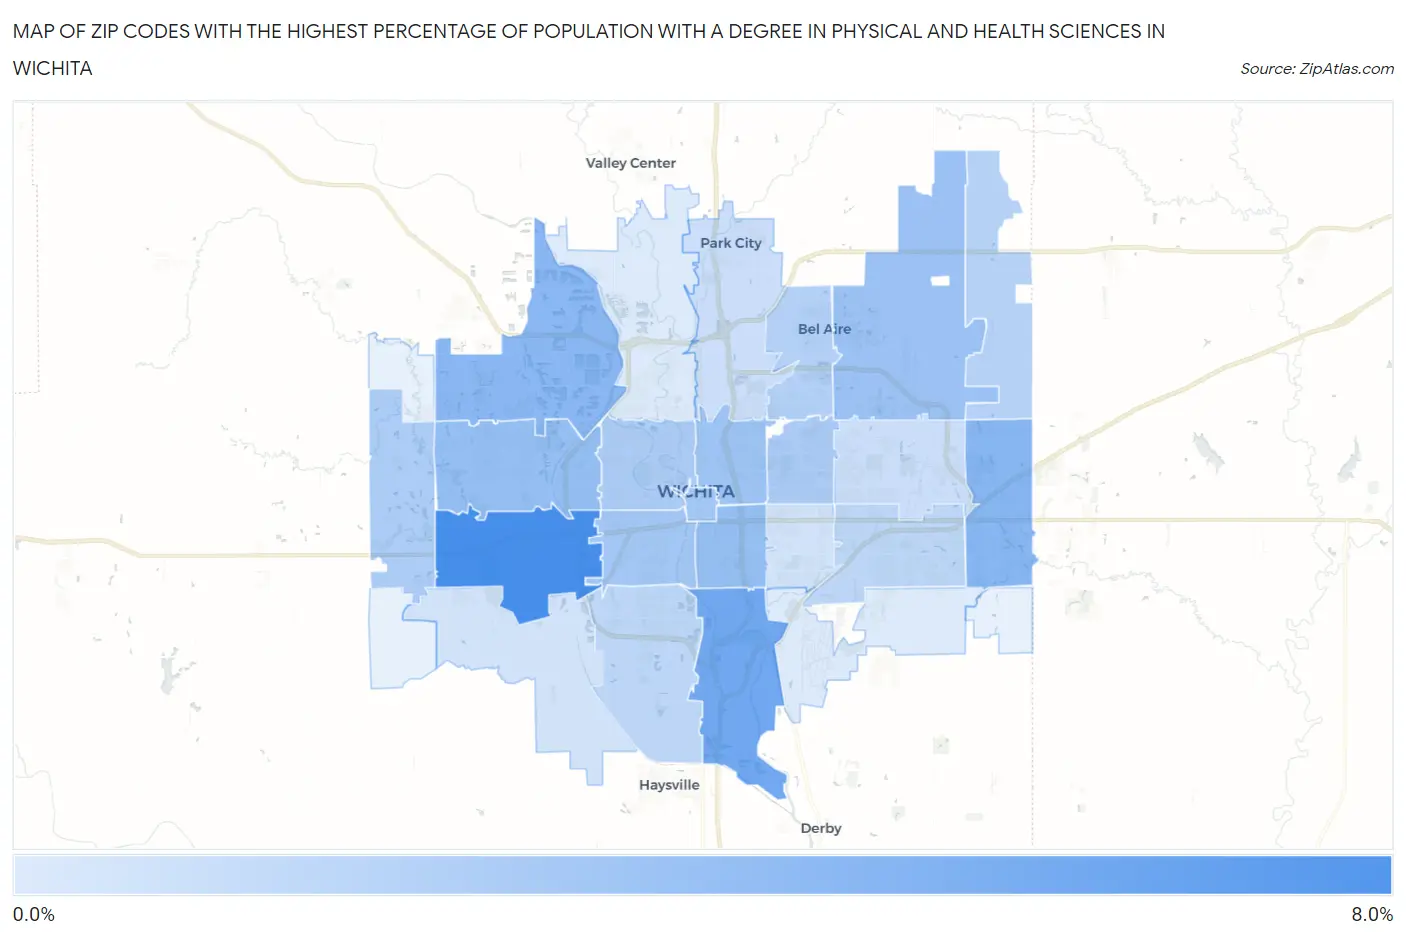
Map of Zip Codes with the Highest Percentage of Population with a Degree in Physical and Health Sciences in Wichita
0.82%
6.3%
Zip Codes with the Highest Percentage of Population with a Degree in Physical and Health Sciences in Wichita, KS
| Zip Code | % Graduates | vs State | vs National | |
| 1. | 67209 | 6.3% | 2.5%(+3.73)#70 | 3.1%(+3.18)#3,011 |
| 2. | 67216 | 4.8% | 2.5%(+2.22)#91 | 3.1%(+1.67)#4,978 |
| 3. | 67230 | 3.9% | 2.5%(+1.33)#122 | 3.1%(+0.781)#7,109 |
| 4. | 67205 | 3.8% | 2.5%(+1.28)#125 | 3.1%(+0.731)#7,259 |
| 5. | 67211 | 3.4% | 2.5%(+0.856)#150 | 3.1%(+0.305)#8,779 |
| 6. | 67212 | 3.4% | 2.5%(+0.826)#151 | 3.1%(+0.275)#8,891 |
| 7. | 67226 | 3.2% | 2.5%(+0.654)#157 | 3.1%(+0.103)#9,574 |
| 8. | 67214 | 3.1% | 2.5%(+0.510)#164 | 3.1%(-0.041)#10,166 |
| 9. | 67202 | 2.9% | 2.5%(+0.328)#178 | 3.1%(-0.223)#10,958 |
| 10. | 67213 | 2.8% | 2.5%(+0.299)#181 | 3.1%(-0.251)#11,095 |
| 11. | 67208 | 2.6% | 2.5%(+0.056)#189 | 3.1%(-0.495)#12,223 |
| 12. | 67235 | 2.5% | 2.5%(-0.014)#197 | 3.1%(-0.565)#12,558 |
| 13. | 67203 | 2.5% | 2.5%(-0.033)#200 | 3.1%(-0.584)#12,661 |
| 14. | 67220 | 2.3% | 2.5%(-0.284)#217 | 3.1%(-0.835)#13,846 |
| 15. | 67228 | 2.2% | 2.5%(-0.322)#221 | 3.1%(-0.873)#14,017 |
| 16. | 67207 | 2.0% | 2.5%(-0.596)#243 | 3.1%(-1.15)#15,324 |
| 17. | 67217 | 1.9% | 2.5%(-0.613)#244 | 3.1%(-1.16)#15,389 |
| 18. | 67206 | 1.5% | 2.5%(-1.05)#278 | 3.1%(-1.60)#17,266 |
| 19. | 67219 | 1.4% | 2.5%(-1.10)#283 | 3.1%(-1.65)#17,543 |
| 20. | 67215 | 1.3% | 2.5%(-1.28)#299 | 3.1%(-1.83)#18,256 |
| 21. | 67218 | 1.3% | 2.5%(-1.29)#300 | 3.1%(-1.84)#18,288 |
| 22. | 67210 | 0.83% | 2.5%(-1.72)#334 | 3.1%(-2.27)#19,768 |
| 23. | 67204 | 0.82% | 2.5%(-1.73)#336 | 3.1%(-2.28)#19,796 |
1
Common Questions
What are the Top 10 Zip Codes with the Highest Percentage of Population with a Degree in Physical and Health Sciences in Wichita, KS?
Top 10 Zip Codes with the Highest Percentage of Population with a Degree in Physical and Health Sciences in Wichita, KS are:
What zip code has the Highest Percentage of Population with a Degree in Physical and Health Sciences in Wichita, KS?
67209 has the Highest Percentage of Population with a Degree in Physical and Health Sciences in Wichita, KS with 6.3%.
What is the Percentage of Population with a Degree in Physical and Health Sciences in Wichita, KS?
Percentage of Population with a Degree in Physical and Health Sciences in Wichita is 2.7%.
What is the Percentage of Population with a Degree in Physical and Health Sciences in Kansas?
Percentage of Population with a Degree in Physical and Health Sciences in Kansas is 2.5%.
What is the Percentage of Population with a Degree in Physical and Health Sciences in the United States?
Percentage of Population with a Degree in Physical and Health Sciences in the United States is 3.1%.