Zip Codes with the Highest Percentage of Not-for-profit Organizations in Wichita, KS

RELATED REPORTS & OPTIONS

Not-for-profit Organizations
Population
Families and Households
Female Fertility
Female Fertility (Unmarried)
Race (Community Size)
Race (Percentage)
Ancestry (Community Size)
AfricanAlaska NativeAmericanApacheArabArapahoArgentineanArmenianAustralianAustrianBangladeshiBarbadianBelgianBhutaneseBlackfeetBolivianBrazilianBritishBulgarianBurmeseCajunCanadianCelticCentral AmericanCentral American IndianCherokeeCheyenneChickasawChileanChippewaChoctawColombianComancheCosta RicanCreekCroatianCubanCzechCzechoslovakianDanishDelawareDominicanDutchDutch West IndianEastern EuropeanEcuadorianEgyptianEnglishEthiopianEuropeanFilipinoFinnishFrenchFrench American IndianFrench CanadianGermanGerman RussianGhanaianGreekGuamanian / ChamorroGuatemalanHaitianHonduranHungarianIcelanderIndian (Asian)IndonesianInupiatIranianIrishIroquoisItalianJamaicanJapaneseJordanianKenyanKiowaKoreanLaotianLebaneseLithuanianLuxembourgerMalaysianMexicanMexican American IndianMongolianMoroccanNative HawaiianNavajoNicaraguanNigerianNorthern EuropeanNorwegianOsageOttawaPakistaniPalestinianPanamanianParaguayanPennsylvania GermanPeruvianPimaPolishPortuguesePotawatomiPuebloPuerto RicanRomanianRussianSalvadoranSamoanScandinavianScotch-IrishScottishSeminoleSiouxSlavicSlovakSloveneSouth AfricanSouth AmericanSpaniardSpanishSpanish AmericanSpanish American IndianSri LankanSubsaharan AfricanSwedishSwissSyrianThaiTrinidadian and TobagonianTurkishUgandanUkrainianVenezuelanWelshWest IndianYugoslavian
Ancestry (Percentage)
AfricanAlaska NativeAmericanApacheArabArapahoArgentineanArmenianAustralianAustrianBangladeshiBarbadianBelgianBhutaneseBlackfeetBolivianBrazilianBritishBulgarianBurmeseCajunCanadianCelticCentral AmericanCentral American IndianCherokeeCheyenneChickasawChileanChippewaChoctawColombianComancheCosta RicanCreekCroatianCubanCzechCzechoslovakianDanishDelawareDominicanDutchDutch West IndianEastern EuropeanEcuadorianEgyptianEnglishEthiopianEuropeanFilipinoFinnishFrenchFrench American IndianFrench CanadianGermanGerman RussianGhanaianGreekGuamanian / ChamorroGuatemalanHaitianHonduranHungarianIcelanderIndian (Asian)IndonesianInupiatIranianIrishIroquoisItalianJamaicanJapaneseJordanianKenyanKiowaKoreanLaotianLebaneseLithuanianLuxembourgerMalaysianMexicanMexican American IndianMongolianMoroccanNative HawaiianNavajoNicaraguanNigerianNorthern EuropeanNorwegianOsageOttawaPakistaniPalestinianPanamanianParaguayanPennsylvania GermanPeruvianPimaPolishPortuguesePotawatomiPuebloPuerto RicanRomanianRussianSalvadoranSamoanScandinavianScotch-IrishScottishSeminoleSiouxSlavicSlovakSloveneSouth AfricanSouth AmericanSpaniardSpanishSpanish AmericanSpanish American IndianSri LankanSubsaharan AfricanSwedishSwissSyrianThaiTrinidadian and TobagonianTurkishUgandanUkrainianVenezuelanWelshWest IndianYugoslavian
Immigrant Origin (Total)
Immigrant Origin (Percentage)
Income
Income (Families)
Income (Households)
Poverty
Poverty (Families)
Unemployment
Employment Occupations
Employment Industries
Employer Class
Commute Time
Commute Means
School Enrollment
Education by Degree Field
Occupancy
Finances
Physical Characteristics
Wichita
Compare Zip Codes
Comparison Subject

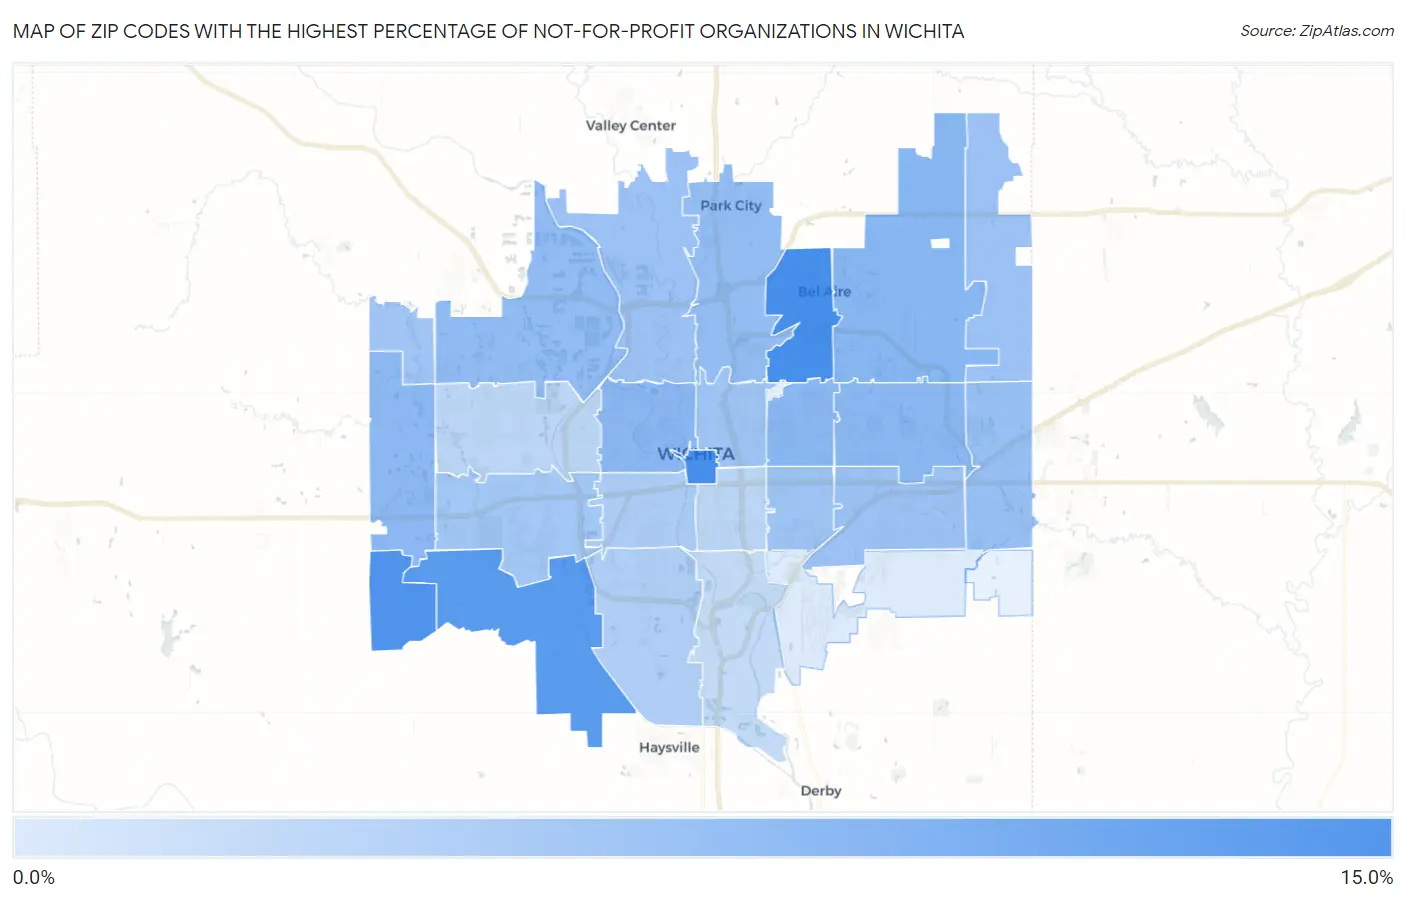
Map of Zip Codes with the Highest Percentage of Not-for-profit Organizations in Wichita

0.0%
15.0%
Zip Codes with the Highest Percentage of Not-for-profit Organizations in Wichita Map

Zip Codes with the Highest Percentage of Not-for-profit Organizations in Wichita, KS

Zip Code % Employed in Not-for-profit vs State vs National
1.6720214.1%8.1%(+5.98)#608.4%(+5.68)#3,477
2.6722014.0%8.1%(+5.90)#628.4%(+5.60)#3,550
3.6722713.5%8.1%(+5.32)#738.4%(+5.02)#4,051
4.6721512.9%8.1%(+4.75)#848.4%(+4.45)#4,605
5.672269.5%8.1%(+1.35)#1958.4%(+1.05)#9,974
6.672089.4%8.1%(+1.30)#1988.4%(+1.00)#10,067
7.672069.4%8.1%(+1.30)#1998.4%(+0.998)#10,075
8.672039.3%8.1%(+1.19)#2028.4%(+0.892)#10,290
9.672359.2%8.1%(+1.05)#2128.4%(+0.744)#10,623
10.672058.9%8.1%(+0.734)#2278.4%(+0.432)#11,378
11.672198.7%8.1%(+0.602)#2338.4%(+0.301)#11,691
12.672308.4%8.1%(+0.241)#2508.4%(-0.061)#12,602
13.672288.2%8.1%(+0.071)#2588.4%(-0.231)#13,058
14.672078.2%8.1%(+0.053)#2598.4%(-0.249)#13,121
15.672048.2%8.1%(+0.044)#2618.4%(-0.258)#13,145
16.672148.0%8.1%(-0.122)#2748.4%(-0.424)#13,573
17.672188.0%8.1%(-0.143)#2758.4%(-0.445)#13,633
18.672237.7%8.1%(-0.406)#2928.4%(-0.708)#14,362
19.672097.6%8.1%(-0.527)#3028.4%(-0.828)#14,714
20.672137.0%8.1%(-1.11)#3338.4%(-1.41)#16,474
21.672176.9%8.1%(-1.24)#3418.4%(-1.54)#16,877
22.672116.0%8.1%(-2.18)#4128.4%(-2.48)#19,573
23.672125.9%8.1%(-2.24)#4188.4%(-2.54)#19,760
24.672165.4%8.1%(-2.74)#4468.4%(-3.04)#21,209
25.672103.8%8.1%(-4.36)#5258.4%(-4.66)#25,161

Common Questions

What are the Top 10 Zip Codes with the Highest Percentage of Not-for-profit Organizations in Wichita, KS?
Top 10 Zip Codes with the Highest Percentage of Not-for-profit Organizations in Wichita, KS are:
#1
14.1%
#2
14.0%
#3
13.5%
#4
12.9%
#5
9.5%
#6
9.4%
#7
9.4%
#8
9.3%
#9
9.2%
#10
8.9%
What zip code has the Highest Percentage of Not-for-profit Organizations in Wichita, KS?
67202 has the Highest Percentage of Not-for-profit Organizations in Wichita, KS with 14.1%.
What is the Percentage of Not-for-profit Organizations in Wichita, KS?
Percentage of Not-for-profit Organizations in Wichita is 8.2%.
What is the Percentage of Not-for-profit Organizations in Kansas?
Percentage of Not-for-profit Organizations in Kansas is 8.1%.
What is the Percentage of Not-for-profit Organizations in the United States?
Percentage of Not-for-profit Organizations in the United States is 8.4%.