Zip Codes with the Highest Percentage of Population with a Degree in Science and Engineering in Topeka, KS
RELATED REPORTS & OPTIONS
Science and Engineering
Topeka
Compare Zip Codes
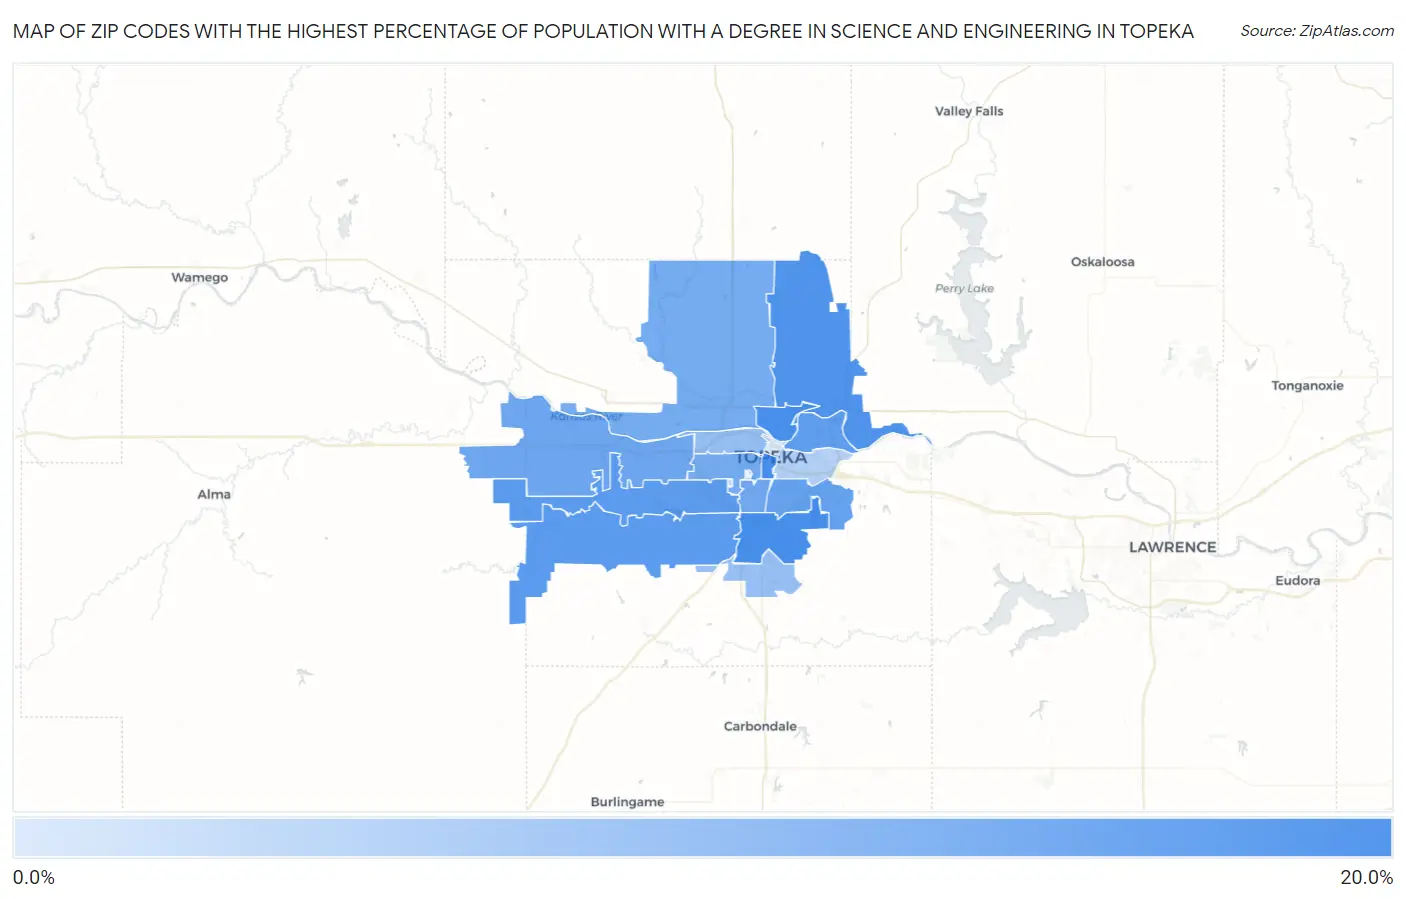
Map of Zip Codes with the Highest Percentage of Population with a Degree in Science and Engineering in Topeka
0.56%
16.3%
Zip Codes with the Highest Percentage of Population with a Degree in Science and Engineering in Topeka, KS
| Zip Code | % Graduates | vs State | vs National | |
| 1. | 66608 | 16.3% | 11.1%(+5.13)#145 | 9.8%(+6.48)#5,524 |
| 2. | 66612 | 16.2% | 11.1%(+5.09)#147 | 9.8%(+6.43)#5,560 |
| 3. | 66609 | 16.2% | 11.1%(+5.03)#152 | 9.8%(+6.38)#5,616 |
| 4. | 66617 | 15.5% | 11.1%(+4.40)#166 | 9.8%(+5.74)#6,163 |
| 5. | 66614 | 14.0% | 11.1%(+2.89)#201 | 9.8%(+4.23)#7,837 |
| 6. | 66610 | 13.8% | 11.1%(+2.71)#211 | 9.8%(+4.06)#8,075 |
| 7. | 66616 | 13.4% | 11.1%(+2.25)#221 | 9.8%(+3.60)#8,662 |
| 8. | 66605 | 13.0% | 11.1%(+1.90)#237 | 9.8%(+3.25)#9,200 |
| 9. | 66615 | 11.9% | 11.1%(+0.727)#269 | 9.8%(+2.08)#11,162 |
| 10. | 66611 | 11.7% | 11.1%(+0.526)#280 | 9.8%(+1.88)#11,556 |
| 11. | 66618 | 11.2% | 11.1%(+0.090)#295 | 9.8%(+1.44)#12,405 |
| 12. | 66604 | 11.2% | 11.1%(+0.090)#296 | 9.8%(+1.44)#12,407 |
| 13. | 66606 | 7.8% | 11.1%(-3.30)#419 | 9.8%(-1.95)#20,026 |
| 14. | 66619 | 7.5% | 11.1%(-3.64)#432 | 9.8%(-2.29)#20,749 |
| 15. | 66607 | 4.8% | 11.1%(-6.35)#500 | 9.8%(-5.00)#24,973 |
| 16. | 66622 | 3.7% | 11.1%(-7.43)#533 | 9.8%(-6.08)#25,995 |
| 17. | 66603 | 0.56% | 11.1%(-10.6)#586 | 9.8%(-9.22)#27,427 |
1
Common Questions
What are the Top 10 Zip Codes with the Highest Percentage of Population with a Degree in Science and Engineering in Topeka, KS?
Top 10 Zip Codes with the Highest Percentage of Population with a Degree in Science and Engineering in Topeka, KS are:
What zip code has the Highest Percentage of Population with a Degree in Science and Engineering in Topeka, KS?
66608 has the Highest Percentage of Population with a Degree in Science and Engineering in Topeka, KS with 16.3%.
What is the Percentage of Population with a Degree in Science and Engineering in Topeka, KS?
Percentage of Population with a Degree in Science and Engineering in Topeka is 11.9%.
What is the Percentage of Population with a Degree in Science and Engineering in Kansas?
Percentage of Population with a Degree in Science and Engineering in Kansas is 11.1%.
What is the Percentage of Population with a Degree in Science and Engineering in the United States?
Percentage of Population with a Degree in Science and Engineering in the United States is 9.8%.