Zip Codes with the Highest Percentage of Population Employed in Farming, Fishing & Forestry in Topeka, KS
RELATED REPORTS & OPTIONS
Farming, Fishing & Forestry
Topeka
Compare Zip Codes
Map of Zip Codes with the Highest Percentage of Population Employed in Farming, Fishing & Forestry in Topeka
0.14%
2.1%
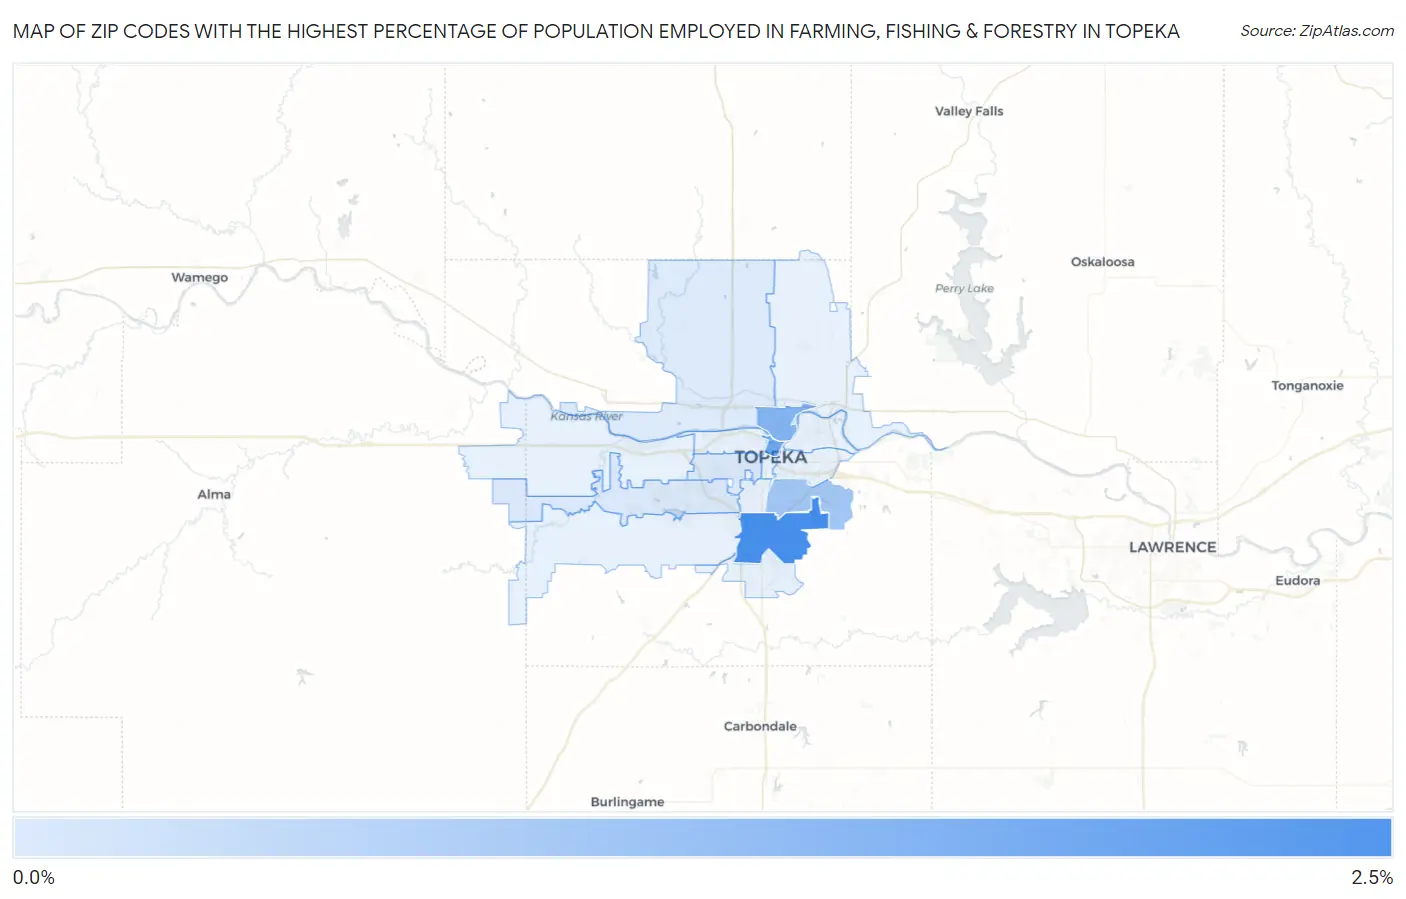
Zip Codes with the Highest Percentage of Population Employed in Farming, Fishing & Forestry in Topeka, KS
| Zip Code | % Employed | vs State | vs National | |
| 1. | 66609 | 2.1% | 0.91% (+1.19)#220 | 0.61% (+1.49)#6,335 |
| 2. | 66603 | 1.6% | 0.91% (+0.667)#273 | 0.61% (+0.972)#7,658 |
| 3. | 66608 | 1.3% | 0.91% (+0.405)#294 | 0.61% (+0.710)#8,511 |
| 4. | 66605 | 0.88% | 0.91% (-0.029)#337 | 0.61% (+0.276)#10,320 |
| 5. | 66604 | 0.17% | 0.91% (-0.740)#435 | 0.61% (-0.435)#16,563 |
| 6. | 66614 | 0.16% | 0.91% (-0.749)#436 | 0.61% (-0.444)#16,722 |
| 7. | 66618 | 0.14% | 0.91% (-0.774)#437 | 0.61% (-0.469)#17,177 |
1
Common Questions
What are the Top 10 Zip Codes with the Highest Percentage of Population Employed in Farming, Fishing & Forestry in Topeka, KS?
Top 10 Zip Codes with the Highest Percentage of Population Employed in Farming, Fishing & Forestry in Topeka, KS are:
What zip code has the Highest Percentage of Population Employed in Farming, Fishing & Forestry in Topeka, KS?
66609 has the Highest Percentage of Population Employed in Farming, Fishing & Forestry in Topeka, KS with 2.1%.
What is the Percentage of Population Employed in Farming, Fishing & Forestry in Topeka, KS?
Percentage of Population Employed in Farming, Fishing & Forestry in Topeka is 0.40%.
What is the Percentage of Population Employed in Farming, Fishing & Forestry in Kansas?
Percentage of Population Employed in Farming, Fishing & Forestry in Kansas is 0.91%.
What is the Percentage of Population Employed in Farming, Fishing & Forestry in the United States?
Percentage of Population Employed in Farming, Fishing & Forestry in the United States is 0.61%.