Zip Codes with the Highest Percentage of Population Employed in Installation, Maintenance & Repair in Mission, KS
RELATED REPORTS & OPTIONS
Installation, Maintenance & Repair
Mission
Compare Zip Codes
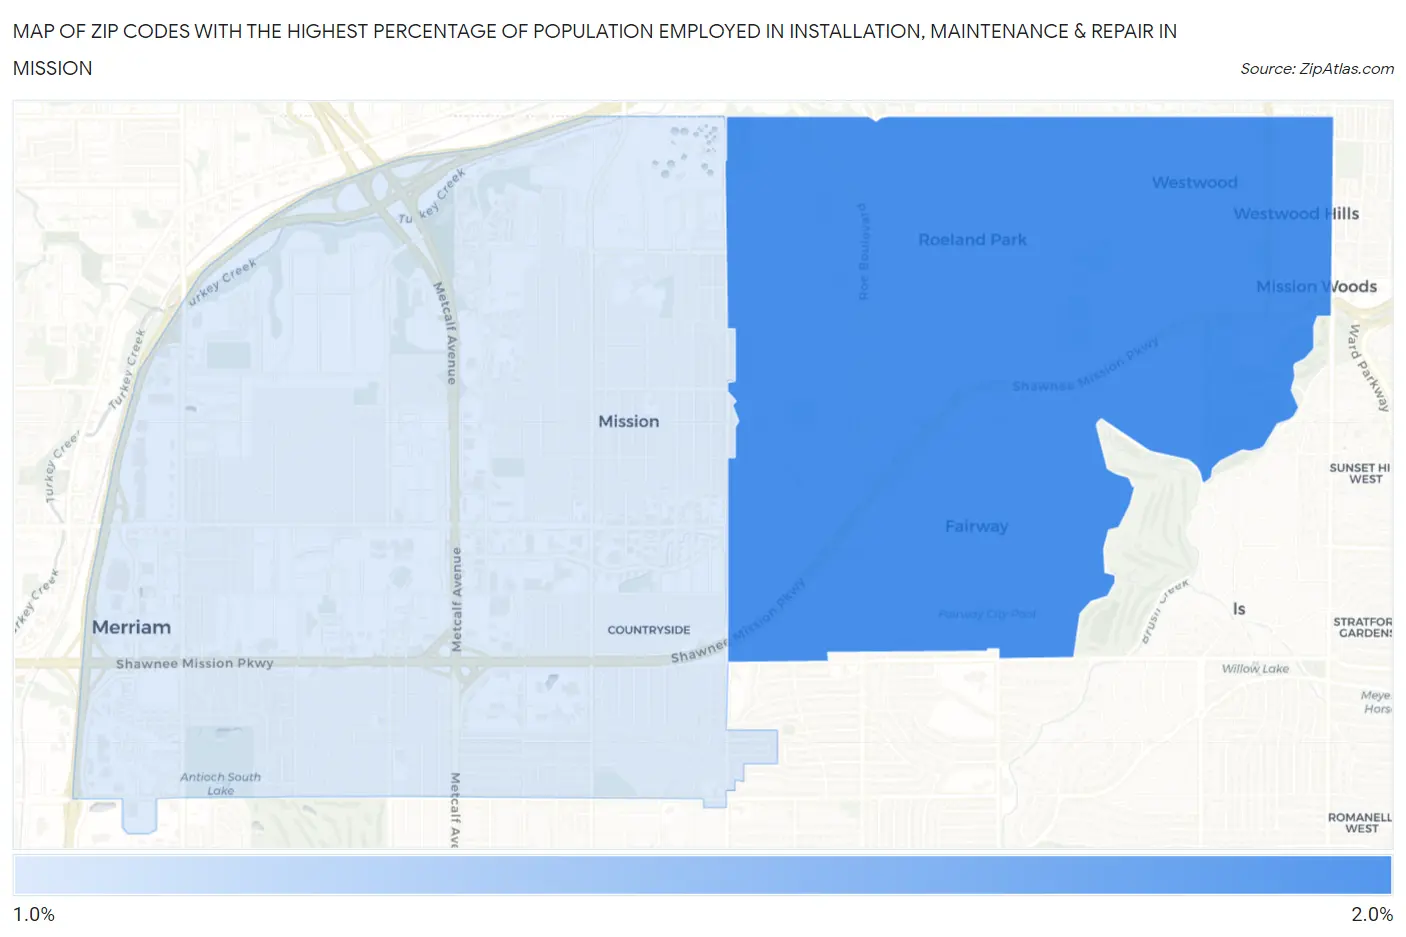
Map of Zip Codes with the Highest Percentage of Population Employed in Installation, Maintenance & Repair in Mission
1.4%
1.5%
Zip Codes with the Highest Percentage of Population Employed in Installation, Maintenance & Repair in Mission, KS
| Zip Code | % Employed | vs State | vs National | |
| 1. | 66205 | 1.5% | 3.6%(-2.11)#521 | 3.1%(-1.56)#24,133 |
| 2. | 66202 | 1.4% | 3.6%(-2.23)#532 | 3.1%(-1.68)#24,591 |
1
Common Questions
What are the Top Zip Codes with the Highest Percentage of Population Employed in Installation, Maintenance & Repair in Mission, KS?
Top Zip Codes with the Highest Percentage of Population Employed in Installation, Maintenance & Repair in Mission, KS are:
What zip code has the Highest Percentage of Population Employed in Installation, Maintenance & Repair in Mission, KS?
66205 has the Highest Percentage of Population Employed in Installation, Maintenance & Repair in Mission, KS with 1.5%.
What is the Percentage of Population Employed in Installation, Maintenance & Repair in Mission, KS?
Percentage of Population Employed in Installation, Maintenance & Repair in Mission is 2.2%.
What is the Percentage of Population Employed in Installation, Maintenance & Repair in Kansas?
Percentage of Population Employed in Installation, Maintenance & Repair in Kansas is 3.6%.
What is the Percentage of Population Employed in Installation, Maintenance & Repair in the United States?
Percentage of Population Employed in Installation, Maintenance & Repair in the United States is 3.1%.