Zip Codes with the Highest Percentage of Not-for-profit Organizations in Mission, KS
RELATED REPORTS & OPTIONS
Not-for-profit Organizations
Mission
Compare Zip Codes
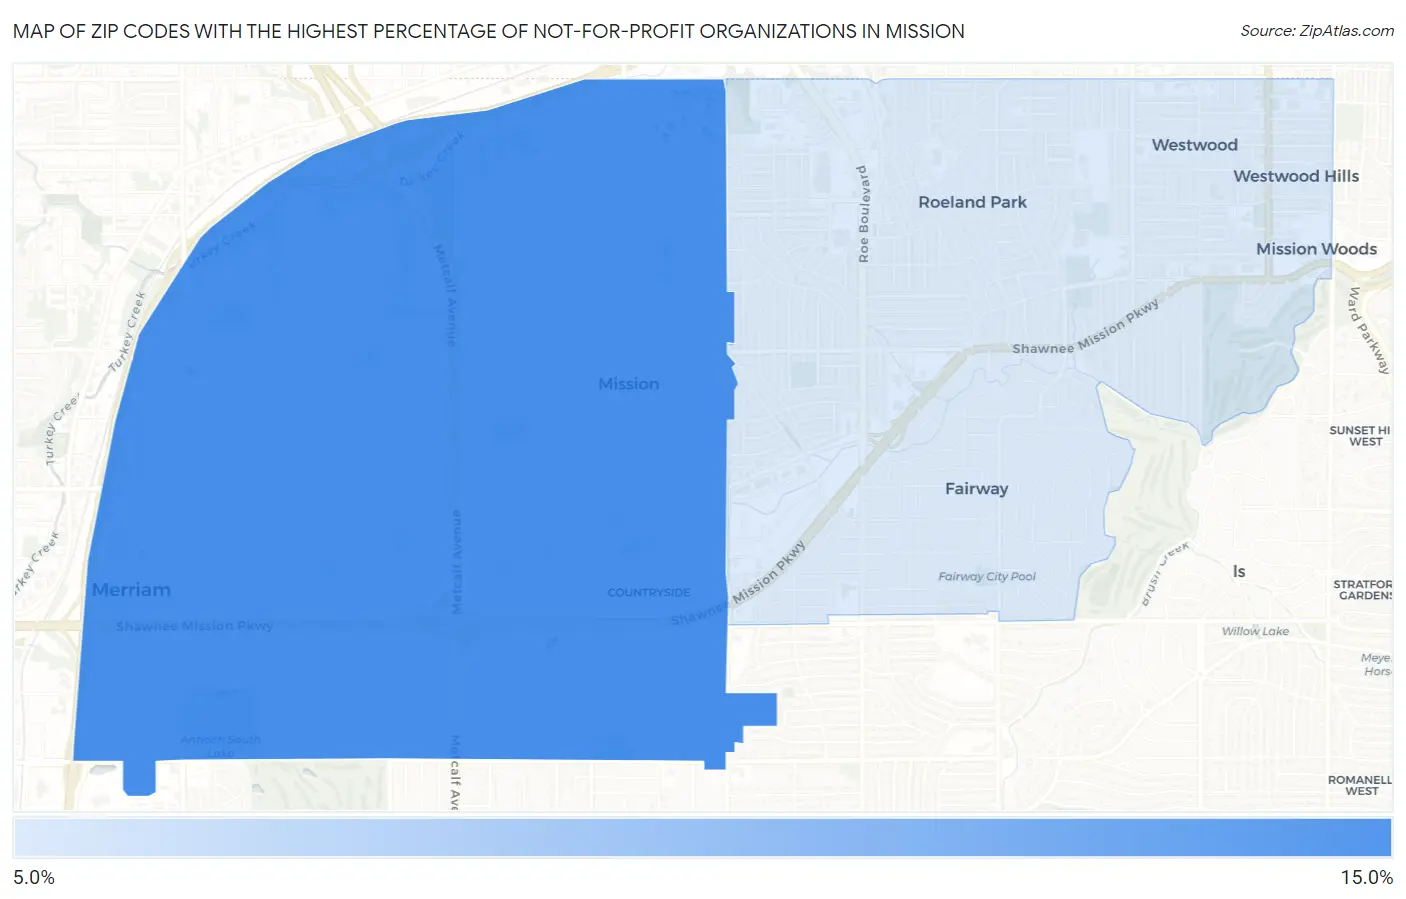
Map of Zip Codes with the Highest Percentage of Not-for-profit Organizations in Mission
10.9%
11.3%
Zip Codes with the Highest Percentage of Not-for-profit Organizations in Mission, KS
| Zip Code | % Employed in Not-for-profit | vs State | vs National | |
| 1. | 66202 | 11.3% | 8.1%(+3.15)#128 | 8.4%(+2.85)#6,590 |
| 2. | 66205 | 10.9% | 8.1%(+2.73)#140 | 8.4%(+2.43)#7,260 |
1
Common Questions
What are the Top Zip Codes with the Highest Percentage of Not-for-profit Organizations in Mission, KS?
Top Zip Codes with the Highest Percentage of Not-for-profit Organizations in Mission, KS are:
What zip code has the Highest Percentage of Not-for-profit Organizations in Mission, KS?
66202 has the Highest Percentage of Not-for-profit Organizations in Mission, KS with 11.3%.
What is the Percentage of Not-for-profit Organizations in Mission, KS?
Percentage of Not-for-profit Organizations in Mission is 11.3%.
What is the Percentage of Not-for-profit Organizations in Kansas?
Percentage of Not-for-profit Organizations in Kansas is 8.1%.
What is the Percentage of Not-for-profit Organizations in the United States?
Percentage of Not-for-profit Organizations in the United States is 8.4%.