Guamanian/Chamorro vs German Median Male Earnings
COMPARE
Guamanian/Chamorro
German
Median Male Earnings
Median Male Earnings Comparison
Guamanians/Chamorros
Germans
$53,661
MEDIAN MALE EARNINGS
30.7/ 100
METRIC RATING
191st/ 347
METRIC RANK
$54,974
MEDIAN MALE EARNINGS
61.6/ 100
METRIC RATING
166th/ 347
METRIC RANK
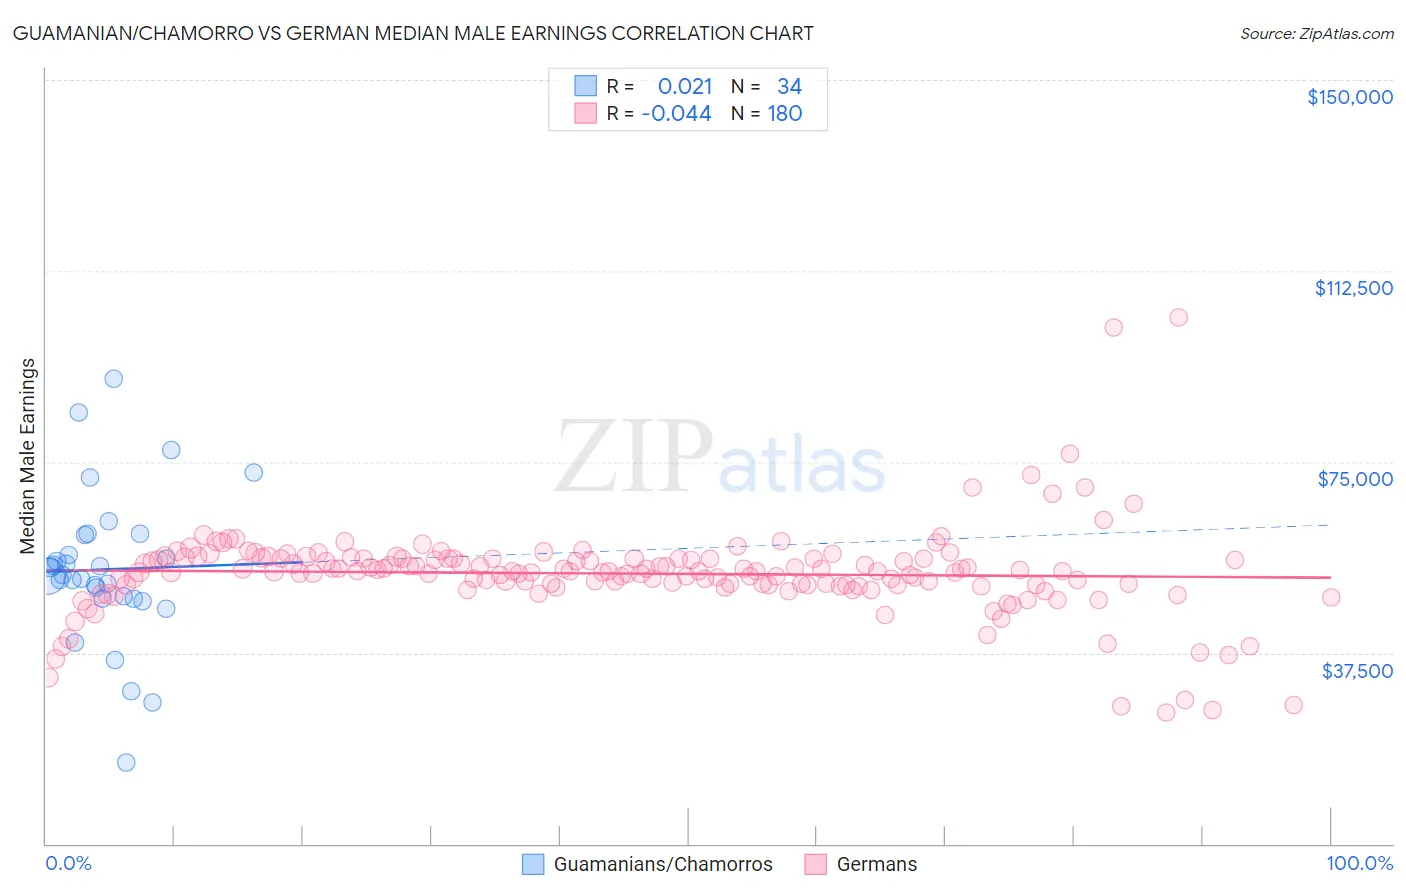
Guamanian/Chamorro vs German Median Male Earnings Correlation Chart
The statistical analysis conducted on geographies consisting of 221,944,725 people shows no correlation between the proportion of Guamanians/Chamorros and median male earnings in the United States with a correlation coefficient (R) of 0.021 and weighted average of $53,661. Similarly, the statistical analysis conducted on geographies consisting of 579,097,396 people shows no correlation between the proportion of Germans and median male earnings in the United States with a correlation coefficient (R) of -0.044 and weighted average of $54,974, a difference of 2.5%.
Median Male Earnings Correlation Summary
| Measurement | Guamanian/Chamorro | German |
| Minimum | $15,938 | $25,882 |
| Maximum | $91,265 | $103,432 |
| Range | $75,327 | $77,550 |
| Mean | $53,880 | $53,076 |
| Median | $52,699 | $53,458 |
| Interquartile 25% (IQ1) | $48,166 | $50,831 |
| Interquartile 75% (IQ3) | $60,575 | $56,007 |
| Interquartile Range (IQR) | $12,408 | $5,176 |
| Standard Deviation (Sample) | $14,873 | $8,925 |
| Standard Deviation (Population) | $14,653 | $8,900 |
Similar Demographics by Median Male Earnings
Demographics Similar to Guamanians/Chamorros by Median Male Earnings
In terms of median male earnings, the demographic groups most similar to Guamanians/Chamorros are Scotch-Irish ($53,658, a difference of 0.010%), Kenyan ($53,647, a difference of 0.030%), Uruguayan ($53,680, a difference of 0.040%), Puget Sound Salish ($53,704, a difference of 0.080%), and Immigrants from Eritrea ($53,715, a difference of 0.10%).
| Demographics | Rating | Rank | Median Male Earnings |
| Whites/Caucasians | 36.5 /100 | #184 | Fair $53,925 |
| Immigrants | Sierra Leone | 36.0 /100 | #185 | Fair $53,905 |
| Colombians | 34.4 /100 | #186 | Fair $53,832 |
| Immigrants | Eritrea | 31.8 /100 | #187 | Fair $53,715 |
| Immigrants | Eastern Africa | 31.8 /100 | #188 | Fair $53,713 |
| Puget Sound Salish | 31.6 /100 | #189 | Fair $53,704 |
| Uruguayans | 31.1 /100 | #190 | Fair $53,680 |
| Guamanians/Chamorros | 30.7 /100 | #191 | Fair $53,661 |
| Scotch-Irish | 30.6 /100 | #192 | Fair $53,658 |
| Kenyans | 30.4 /100 | #193 | Fair $53,647 |
| Spanish | 29.0 /100 | #194 | Fair $53,576 |
| Immigrants | Azores | 27.5 /100 | #195 | Fair $53,503 |
| Immigrants | Africa | 26.6 /100 | #196 | Fair $53,457 |
| Immigrants | Kenya | 26.0 /100 | #197 | Fair $53,427 |
| Immigrants | Costa Rica | 22.6 /100 | #198 | Fair $53,237 |
Demographics Similar to Germans by Median Male Earnings
In terms of median male earnings, the demographic groups most similar to Germans are Immigrants from Fiji ($54,958, a difference of 0.030%), Immigrants from Vietnam ($54,913, a difference of 0.11%), Immigrants from Portugal ($55,182, a difference of 0.38%), French Canadian ($54,722, a difference of 0.46%), and Finnish ($54,721, a difference of 0.46%).
| Demographics | Rating | Rank | Median Male Earnings |
| Alsatians | 70.5 /100 | #159 | Good $55,380 |
| Basques | 70.3 /100 | #160 | Good $55,370 |
| Belgians | 70.1 /100 | #161 | Good $55,361 |
| French | 69.9 /100 | #162 | Good $55,350 |
| Ugandans | 68.6 /100 | #163 | Good $55,290 |
| Immigrants | South Eastern Asia | 67.6 /100 | #164 | Good $55,241 |
| Immigrants | Portugal | 66.3 /100 | #165 | Good $55,182 |
| Germans | 61.6 /100 | #166 | Good $54,974 |
| Immigrants | Fiji | 61.2 /100 | #167 | Good $54,958 |
| Immigrants | Vietnam | 60.2 /100 | #168 | Good $54,913 |
| French Canadians | 55.6 /100 | #169 | Average $54,722 |
| Finns | 55.6 /100 | #170 | Average $54,721 |
| Immigrants | Peru | 54.9 /100 | #171 | Average $54,695 |
| Welsh | 53.8 /100 | #172 | Average $54,647 |
| South American Indians | 50.4 /100 | #173 | Average $54,508 |