Guamanian/Chamorro vs Immigrants from Venezuela Median Male Earnings
COMPARE
Guamanian/Chamorro
Immigrants from Venezuela
Median Male Earnings
Median Male Earnings Comparison
Guamanians/Chamorros
Immigrants from Venezuela
$53,661
MEDIAN MALE EARNINGS
30.7/ 100
METRIC RATING
191st/ 347
METRIC RANK
$52,041
MEDIAN MALE EARNINGS
8.3/ 100
METRIC RATING
216th/ 347
METRIC RANK
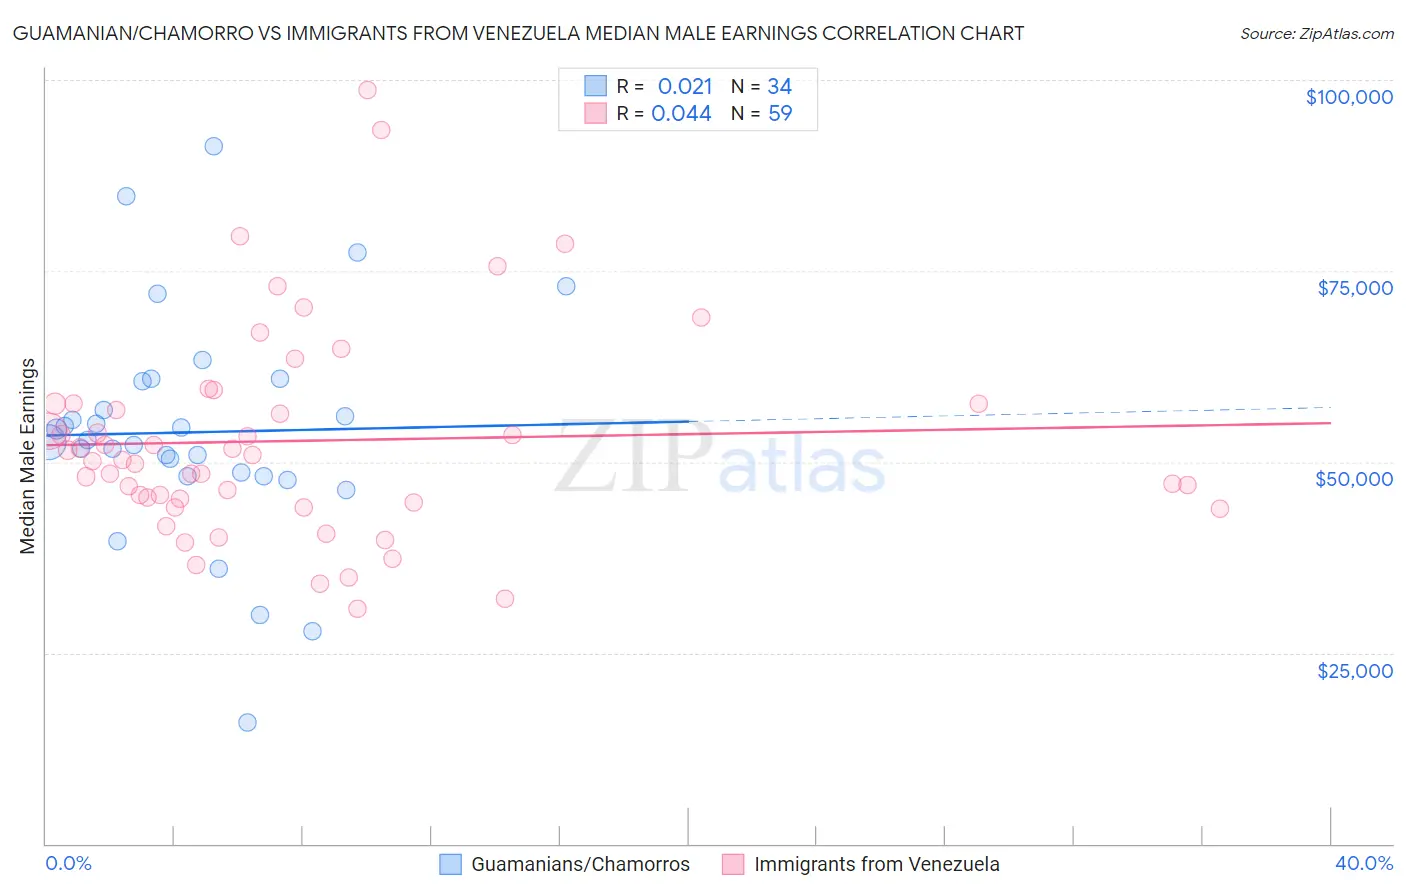
Guamanian/Chamorro vs Immigrants from Venezuela Median Male Earnings Correlation Chart
The statistical analysis conducted on geographies consisting of 221,944,725 people shows no correlation between the proportion of Guamanians/Chamorros and median male earnings in the United States with a correlation coefficient (R) of 0.021 and weighted average of $53,661. Similarly, the statistical analysis conducted on geographies consisting of 287,825,740 people shows no correlation between the proportion of Immigrants from Venezuela and median male earnings in the United States with a correlation coefficient (R) of 0.044 and weighted average of $52,041, a difference of 3.1%.
Median Male Earnings Correlation Summary
| Measurement | Guamanian/Chamorro | Immigrants from Venezuela |
| Minimum | $15,938 | $30,787 |
| Maximum | $91,265 | $98,656 |
| Range | $75,327 | $67,869 |
| Mean | $53,880 | $52,768 |
| Median | $52,699 | $50,259 |
| Interquartile 25% (IQ1) | $48,166 | $44,609 |
| Interquartile 75% (IQ3) | $60,575 | $57,648 |
| Interquartile Range (IQR) | $12,408 | $13,039 |
| Standard Deviation (Sample) | $14,873 | $13,735 |
| Standard Deviation (Population) | $14,653 | $13,618 |
Similar Demographics by Median Male Earnings
Demographics Similar to Guamanians/Chamorros by Median Male Earnings
In terms of median male earnings, the demographic groups most similar to Guamanians/Chamorros are Scotch-Irish ($53,658, a difference of 0.010%), Kenyan ($53,647, a difference of 0.030%), Uruguayan ($53,680, a difference of 0.040%), Puget Sound Salish ($53,704, a difference of 0.080%), and Immigrants from Eritrea ($53,715, a difference of 0.10%).
| Demographics | Rating | Rank | Median Male Earnings |
| Whites/Caucasians | 36.5 /100 | #184 | Fair $53,925 |
| Immigrants | Sierra Leone | 36.0 /100 | #185 | Fair $53,905 |
| Colombians | 34.4 /100 | #186 | Fair $53,832 |
| Immigrants | Eritrea | 31.8 /100 | #187 | Fair $53,715 |
| Immigrants | Eastern Africa | 31.8 /100 | #188 | Fair $53,713 |
| Puget Sound Salish | 31.6 /100 | #189 | Fair $53,704 |
| Uruguayans | 31.1 /100 | #190 | Fair $53,680 |
| Guamanians/Chamorros | 30.7 /100 | #191 | Fair $53,661 |
| Scotch-Irish | 30.6 /100 | #192 | Fair $53,658 |
| Kenyans | 30.4 /100 | #193 | Fair $53,647 |
| Spanish | 29.0 /100 | #194 | Fair $53,576 |
| Immigrants | Azores | 27.5 /100 | #195 | Fair $53,503 |
| Immigrants | Africa | 26.6 /100 | #196 | Fair $53,457 |
| Immigrants | Kenya | 26.0 /100 | #197 | Fair $53,427 |
| Immigrants | Costa Rica | 22.6 /100 | #198 | Fair $53,237 |
Demographics Similar to Immigrants from Venezuela by Median Male Earnings
In terms of median male earnings, the demographic groups most similar to Immigrants from Venezuela are Nigerian ($52,039, a difference of 0.0%), Immigrants from Cameroon ($52,119, a difference of 0.15%), Immigrants from Panama ($51,962, a difference of 0.15%), Nonimmigrants ($52,170, a difference of 0.25%), and Immigrants from Ghana ($51,836, a difference of 0.40%).
| Demographics | Rating | Rank | Median Male Earnings |
| Bermudans | 12.1 /100 | #209 | Poor $52,465 |
| Delaware | 11.5 /100 | #210 | Poor $52,412 |
| Tlingit-Haida | 11.5 /100 | #211 | Poor $52,409 |
| Cajuns | 10.7 /100 | #212 | Poor $52,325 |
| Native Hawaiians | 10.5 /100 | #213 | Poor $52,306 |
| Immigrants | Nonimmigrants | 9.3 /100 | #214 | Tragic $52,170 |
| Immigrants | Cameroon | 8.9 /100 | #215 | Tragic $52,119 |
| Immigrants | Venezuela | 8.3 /100 | #216 | Tragic $52,041 |
| Nigerians | 8.3 /100 | #217 | Tragic $52,039 |
| Immigrants | Panama | 7.7 /100 | #218 | Tragic $51,962 |
| Immigrants | Ghana | 6.9 /100 | #219 | Tragic $51,836 |
| Immigrants | Armenia | 6.6 /100 | #220 | Tragic $51,793 |
| Immigrants | Senegal | 5.8 /100 | #221 | Tragic $51,647 |
| Immigrants | Bangladesh | 5.8 /100 | #222 | Tragic $51,642 |
| Ecuadorians | 5.5 /100 | #223 | Tragic $51,596 |