White/Caucasian Median Male Earnings
COMPARE
White/Caucasian
Select to Compare
Median Male Earnings
White/Caucasian Median Male Earnings
$53,925
EARNINGS | MALES
36.5/ 100
METRIC RATING
184th/ 347
METRIC RANK
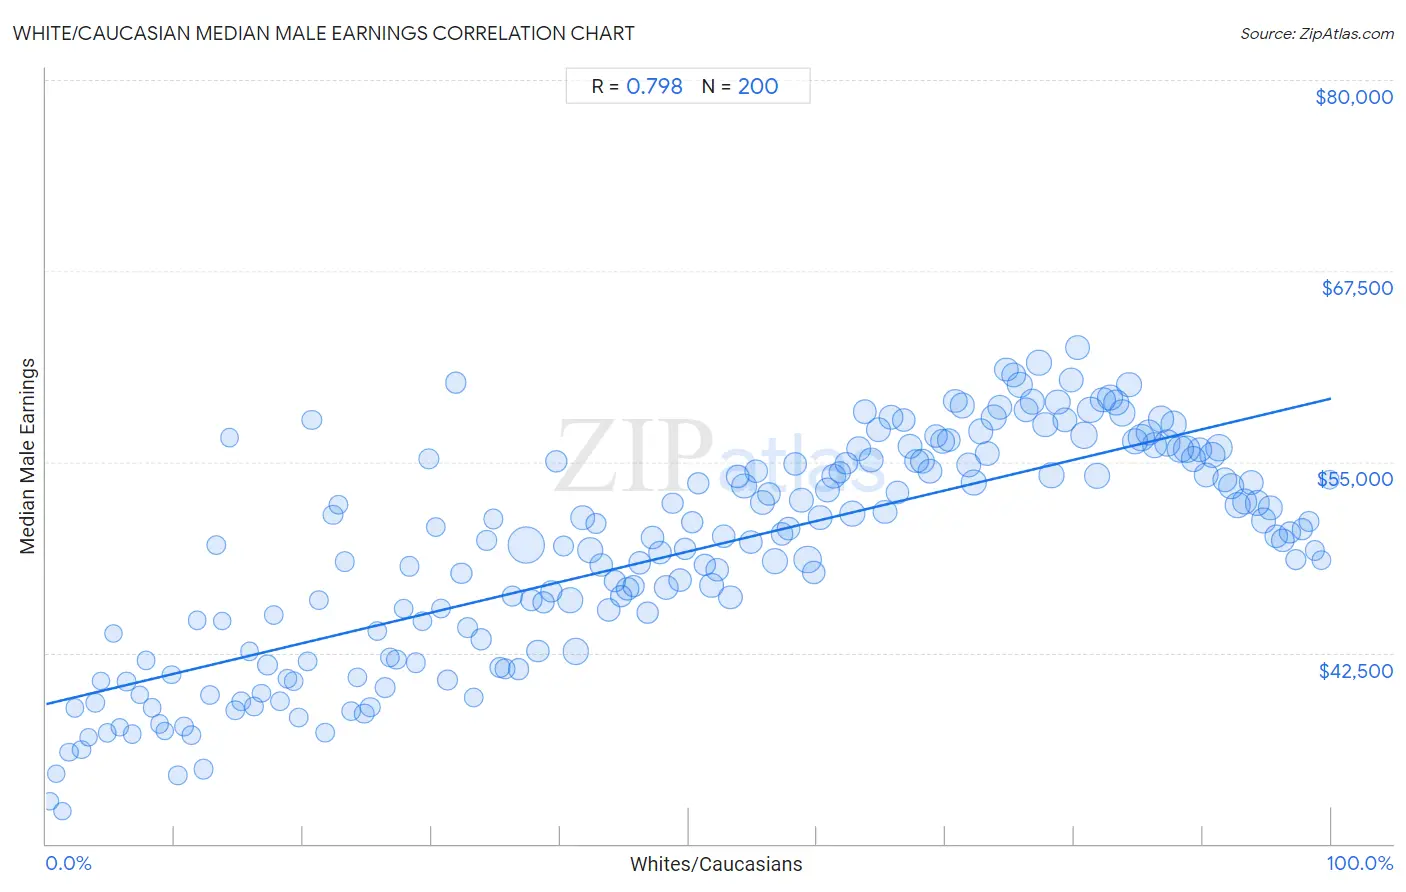
White/Caucasian Median Male Earnings Correlation Chart
The statistical analysis conducted on geographies consisting of 582,594,178 people shows a strong positive correlation between the proportion of Whites/Caucasians and median male earnings in the United States with a correlation coefficient (R) of 0.798 and weighted average of $53,925. On average, for every 1% (one percent) increase in Whites/Caucasians within a typical geography, there is an increase of $200 in median male earnings.
It is essential to understand that the correlation between the percentage of Whites/Caucasians and median male earnings does not imply a direct cause-and-effect relationship. It remains uncertain whether the presence of Whites/Caucasians influences an upward or downward trend in the level of median male earnings within an area, or if Whites/Caucasians simply ended up residing in those areas with higher or lower levels of median male earnings due to other factors.
Demographics Similar to Whites/Caucasians by Median Male Earnings
In terms of median male earnings, the demographic groups most similar to Whites/Caucasians are Immigrants from Sierra Leone ($53,905, a difference of 0.040%), Immigrants from South America ($53,962, a difference of 0.070%), Yugoslavian ($53,967, a difference of 0.080%), Colombian ($53,832, a difference of 0.17%), and Immigrants from Eritrea ($53,715, a difference of 0.39%).
| Demographics | Rating | Rank | Median Male Earnings |
| Costa Ricans | 44.8 /100 | #177 | Average $54,279 |
| Sierra Leoneans | 44.8 /100 | #178 | Average $54,279 |
| Celtics | 43.9 /100 | #179 | Average $54,242 |
| Iraqis | 42.5 /100 | #180 | Average $54,182 |
| Immigrants | 42.1 /100 | #181 | Average $54,168 |
| Yugoslavians | 37.4 /100 | #182 | Fair $53,967 |
| Immigrants from South America | 37.3 /100 | #183 | Fair $53,962 |
| Whites/Caucasians | 36.5 /100 | #184 | Fair $53,925 |
| Immigrants from Sierra Leone | 36.0 /100 | #185 | Fair $53,905 |
| Colombians | 34.4 /100 | #186 | Fair $53,832 |
| Immigrants from Eritrea | 31.8 /100 | #187 | Fair $53,715 |
| Immigrants from Eastern Africa | 31.8 /100 | #188 | Fair $53,713 |
| Puget Sound Salish | 31.6 /100 | #189 | Fair $53,704 |
| Uruguayans | 31.1 /100 | #190 | Fair $53,680 |
| Guamanians/Chamorros | 30.7 /100 | #191 | Fair $53,661 |
White/Caucasian Median Male Earnings Correlation Summary
| Measurement | White/Caucasian Data | Median Male Earnings Data |
| Minimum | 0.32% | $32,128 |
| Maximum | 99.9% | $62,517 |
| Range | 99.6% | $30,389 |
| Mean | 50.0% | $49,142 |
| Median | 50.0% | $50,057 |
| Interquartile 25% (IQ1) | 25.0% | $42,596 |
| Interquartile 75% (IQ3) | 75.0% | $55,134 |
| Interquartile Range (IQR) | 50.0% | $12,539 |
| Standard Deviation (Sample) | 28.9% | $7,259 |
| Standard Deviation (Population) | 28.9% | $7,240 |
Correlation Details
| White/Caucasian Percentile | Sample Size | Median Male Earnings |
[ 0.0% - 0.5% ] 0.32% | 60,320 | $32,806 |
[ 0.5% - 1.0% ] 0.80% | 65,007 | $34,542 |
[ 1.0% - 1.5% ] 1.26% | 172,684 | $32,128 |
[ 1.5% - 2.0% ] 1.77% | 464,212 | $35,993 |
[ 2.0% - 2.5% ] 2.21% | 306,532 | $38,880 |
[ 2.5% - 3.0% ] 2.76% | 533,655 | $36,147 |
[ 3.0% - 3.5% ] 3.26% | 352,106 | $36,978 |
[ 3.5% - 4.0% ] 3.80% | 508,190 | $39,213 |
[ 4.0% - 4.5% ] 4.25% | 458,820 | $40,640 |
[ 4.5% - 5.0% ] 4.76% | 428,226 | $37,254 |
[ 5.0% - 5.5% ] 5.23% | 433,691 | $43,756 |
[ 5.5% - 6.0% ] 5.75% | 360,314 | $37,617 |
[ 6.0% - 6.5% ] 6.27% | 451,113 | $40,612 |
[ 6.5% - 7.0% ] 6.68% | 426,210 | $37,192 |
[ 7.0% - 7.5% ] 7.30% | 355,297 | $39,754 |
[ 7.5% - 8.0% ] 7.78% | 341,615 | $42,010 |
[ 8.0% - 8.5% ] 8.24% | 568,968 | $38,921 |
[ 8.5% - 9.0% ] 8.81% | 668,551 | $37,822 |
[ 9.0% - 9.5% ] 9.25% | 385,248 | $37,401 |
[ 9.5% - 10.0% ] 9.74% | 490,502 | $41,081 |
[ 10.0% - 10.5% ] 10.22% | 438,471 | $34,467 |
[ 10.5% - 11.0% ] 10.73% | 508,203 | $37,674 |
[ 11.0% - 11.5% ] 11.28% | 724,083 | $37,112 |
[ 11.5% - 12.0% ] 11.75% | 471,315 | $44,613 |
[ 12.0% - 12.5% ] 12.21% | 1,175,183 | $34,874 |
[ 12.5% - 13.0% ] 12.75% | 901,889 | $39,721 |
[ 13.0% - 13.5% ] 13.27% | 797,611 | $49,566 |
[ 13.5% - 14.0% ] 13.70% | 430,276 | $44,582 |
[ 14.0% - 14.5% ] 14.27% | 709,227 | $56,601 |
[ 14.5% - 15.0% ] 14.71% | 508,573 | $38,720 |
[ 15.0% - 15.5% ] 15.17% | 870,788 | $39,314 |
[ 15.5% - 16.0% ] 15.81% | 704,911 | $42,598 |
[ 16.0% - 16.5% ] 16.15% | 544,418 | $38,994 |
[ 16.5% - 17.0% ] 16.76% | 680,908 | $39,850 |
[ 17.0% - 17.5% ] 17.25% | 1,692,935 | $41,714 |
[ 17.5% - 18.0% ] 17.71% | 877,973 | $44,973 |
[ 18.0% - 18.5% ] 18.21% | 919,715 | $39,366 |
[ 18.5% - 19.0% ] 18.75% | 952,624 | $40,788 |
[ 19.0% - 19.5% ] 19.26% | 1,002,365 | $40,638 |
[ 19.5% - 20.0% ] 19.69% | 915,570 | $38,228 |
[ 20.0% - 20.5% ] 20.31% | 756,852 | $41,963 |
[ 20.5% - 21.0% ] 20.67% | 993,504 | $57,757 |
[ 21.0% - 21.5% ] 21.23% | 739,937 | $45,923 |
[ 21.5% - 22.0% ] 21.70% | 688,692 | $37,275 |
[ 22.0% - 22.5% ] 22.31% | 1,088,423 | $51,503 |
[ 22.5% - 23.0% ] 22.71% | 1,274,665 | $52,172 |
[ 23.0% - 23.5% ] 23.23% | 1,193,255 | $48,467 |
[ 23.5% - 24.0% ] 23.75% | 1,056,658 | $38,709 |
[ 24.0% - 24.5% ] 24.24% | 1,076,814 | $40,900 |
[ 24.5% - 25.0% ] 24.75% | 1,121,185 | $38,490 |
[ 25.0% - 25.5% ] 25.23% | 1,370,873 | $38,934 |
[ 25.5% - 26.0% ] 25.75% | 1,165,743 | $43,935 |
[ 26.0% - 26.5% ] 26.33% | 1,590,312 | $40,212 |
[ 26.5% - 27.0% ] 26.74% | 1,057,107 | $42,177 |
[ 27.0% - 27.5% ] 27.26% | 1,471,768 | $42,058 |
[ 27.5% - 28.0% ] 27.81% | 1,027,565 | $45,372 |
[ 28.0% - 28.5% ] 28.27% | 1,647,736 | $48,137 |
[ 28.5% - 29.0% ] 28.77% | 1,418,425 | $41,846 |
[ 29.0% - 29.5% ] 29.28% | 990,772 | $44,584 |
[ 29.5% - 30.0% ] 29.74% | 1,616,421 | $55,215 |
[ 30.0% - 30.5% ] 30.32% | 1,525,320 | $50,742 |
[ 30.5% - 31.0% ] 30.75% | 1,174,293 | $45,376 |
[ 31.0% - 31.5% ] 31.24% | 1,701,766 | $40,749 |
[ 31.5% - 32.0% ] 31.87% | 2,369,461 | $60,210 |
[ 32.0% - 32.5% ] 32.29% | 2,343,198 | $47,705 |
[ 32.5% - 33.0% ] 32.77% | 1,600,783 | $44,157 |
[ 33.0% - 33.5% ] 33.27% | 942,653 | $39,597 |
[ 33.5% - 34.0% ] 33.82% | 1,890,432 | $43,389 |
[ 34.0% - 34.5% ] 34.27% | 1,167,347 | $49,868 |
[ 34.5% - 35.0% ] 34.79% | 1,437,519 | $51,260 |
[ 35.0% - 35.5% ] 35.27% | 1,819,588 | $41,551 |
[ 35.5% - 36.0% ] 35.73% | 1,668,592 | $41,454 |
[ 36.0% - 36.5% ] 36.25% | 1,973,582 | $46,184 |
[ 36.5% - 37.0% ] 36.75% | 2,023,960 | $41,425 |
[ 37.0% - 37.5% ] 37.37% | 12,681,159 | $49,564 |
[ 37.5% - 38.0% ] 37.71% | 2,486,369 | $45,976 |
[ 38.0% - 38.5% ] 38.24% | 2,888,821 | $42,593 |
[ 38.5% - 39.0% ] 38.72% | 2,811,920 | $45,817 |
[ 39.0% - 39.5% ] 39.28% | 2,413,719 | $46,495 |
[ 39.5% - 40.0% ] 39.72% | 2,515,042 | $55,015 |
[ 40.0% - 40.5% ] 40.24% | 2,007,326 | $49,485 |
[ 40.5% - 41.0% ] 40.78% | 4,865,785 | $45,963 |
[ 41.0% - 41.5% ] 41.21% | 5,720,412 | $42,562 |
[ 41.5% - 42.0% ] 41.77% | 4,022,309 | $51,339 |
[ 42.0% - 42.5% ] 42.32% | 4,848,720 | $49,225 |
[ 42.5% - 43.0% ] 42.76% | 2,126,122 | $50,979 |
[ 43.0% - 43.5% ] 43.19% | 3,449,721 | $48,232 |
[ 43.5% - 44.0% ] 43.79% | 3,478,862 | $45,303 |
[ 44.0% - 44.5% ] 44.24% | 2,773,585 | $47,206 |
[ 44.5% - 45.0% ] 44.74% | 2,722,897 | $46,217 |
[ 45.0% - 45.5% ] 45.27% | 3,313,898 | $46,716 |
[ 45.5% - 46.0% ] 45.71% | 2,781,046 | $46,863 |
[ 46.0% - 46.5% ] 46.21% | 2,978,998 | $48,408 |
[ 46.5% - 47.0% ] 46.77% | 2,387,851 | $45,142 |
[ 47.0% - 47.5% ] 47.21% | 3,360,370 | $50,011 |
[ 47.5% - 48.0% ] 47.75% | 3,358,086 | $49,053 |
[ 48.0% - 48.5% ] 48.24% | 4,299,275 | $46,771 |
[ 48.5% - 49.0% ] 48.73% | 2,402,653 | $52,283 |
[ 49.0% - 49.5% ] 49.29% | 3,333,482 | $47,262 |
[ 49.5% - 50.0% ] 49.74% | 2,477,496 | $49,335 |
[ 50.0% - 50.5% ] 50.26% | 2,960,651 | $51,071 |
[ 50.5% - 51.0% ] 50.75% | 3,221,161 | $53,607 |
[ 51.0% - 51.5% ] 51.23% | 2,807,226 | $48,275 |
[ 51.5% - 52.0% ] 51.79% | 3,771,215 | $46,914 |
[ 52.0% - 52.5% ] 52.20% | 3,790,273 | $47,948 |
[ 52.5% - 53.0% ] 52.76% | 3,459,559 | $50,113 |
[ 53.0% - 53.5% ] 53.23% | 3,665,045 | $46,155 |
[ 53.5% - 54.0% ] 53.78% | 3,224,551 | $54,048 |
[ 54.0% - 54.5% ] 54.32% | 4,578,073 | $53,406 |
[ 54.5% - 55.0% ] 54.82% | 3,926,094 | $49,754 |
[ 55.0% - 55.5% ] 55.28% | 3,505,642 | $54,395 |
[ 55.5% - 56.0% ] 55.75% | 4,332,108 | $52,347 |
[ 56.0% - 56.5% ] 56.24% | 3,125,023 | $52,905 |
[ 56.5% - 57.0% ] 56.71% | 5,209,123 | $48,475 |
[ 57.0% - 57.5% ] 57.25% | 3,203,927 | $50,289 |
[ 57.5% - 58.0% ] 57.74% | 3,640,543 | $50,620 |
[ 58.0% - 58.5% ] 58.26% | 3,213,659 | $54,884 |
[ 58.5% - 59.0% ] 58.75% | 4,041,683 | $52,518 |
[ 59.0% - 59.5% ] 59.26% | 6,613,118 | $48,599 |
[ 59.5% - 60.0% ] 59.75% | 3,434,215 | $47,762 |
[ 60.0% - 60.5% ] 60.24% | 4,100,590 | $51,345 |
[ 60.5% - 61.0% ] 60.76% | 4,276,058 | $53,184 |
[ 61.0% - 61.5% ] 61.31% | 4,265,842 | $54,046 |
[ 61.5% - 62.0% ] 61.77% | 2,872,321 | $54,311 |
[ 62.0% - 62.5% ] 62.23% | 3,275,800 | $54,906 |
[ 62.5% - 63.0% ] 62.76% | 5,277,038 | $51,583 |
[ 63.0% - 63.5% ] 63.24% | 4,341,252 | $55,900 |
[ 63.5% - 64.0% ] 63.72% | 3,663,090 | $58,287 |
[ 64.0% - 64.5% ] 64.23% | 4,357,235 | $55,093 |
[ 64.5% - 65.0% ] 64.76% | 4,656,850 | $57,092 |
[ 65.0% - 65.5% ] 65.30% | 4,203,619 | $51,725 |
[ 65.5% - 66.0% ] 65.73% | 4,579,030 | $57,931 |
[ 66.0% - 66.5% ] 66.26% | 3,499,979 | $53,004 |
[ 66.5% - 67.0% ] 66.78% | 3,369,821 | $57,713 |
[ 67.0% - 67.5% ] 67.25% | 4,215,702 | $56,042 |
[ 67.5% - 68.0% ] 67.75% | 3,709,492 | $55,030 |
[ 68.0% - 68.5% ] 68.23% | 4,365,158 | $55,012 |
[ 68.5% - 69.0% ] 68.77% | 4,357,441 | $54,361 |
[ 69.0% - 69.5% ] 69.23% | 3,724,815 | $56,685 |
[ 69.5% - 70.0% ] 69.76% | 4,176,643 | $56,362 |
[ 70.0% - 70.5% ] 70.24% | 3,347,638 | $56,424 |
[ 70.5% - 71.0% ] 70.73% | 3,843,394 | $58,991 |
[ 71.0% - 71.5% ] 71.27% | 4,505,540 | $58,693 |
[ 71.5% - 72.0% ] 71.76% | 4,306,880 | $54,779 |
[ 72.0% - 72.5% ] 72.23% | 5,051,992 | $53,658 |
[ 72.5% - 73.0% ] 72.72% | 4,940,043 | $56,988 |
[ 73.0% - 73.5% ] 73.26% | 4,573,862 | $55,540 |
[ 73.5% - 74.0% ] 73.74% | 5,106,449 | $57,909 |
[ 74.0% - 74.5% ] 74.24% | 4,492,569 | $58,577 |
[ 74.5% - 75.0% ] 74.75% | 4,077,225 | $61,048 |
[ 75.0% - 75.5% ] 75.27% | 4,270,598 | $60,708 |
[ 75.5% - 76.0% ] 75.73% | 5,335,103 | $60,019 |
[ 76.0% - 76.5% ] 76.24% | 4,500,904 | $58,435 |
[ 76.5% - 77.0% ] 76.75% | 4,449,849 | $58,937 |
[ 77.0% - 77.5% ] 77.25% | 4,794,396 | $61,485 |
[ 77.5% - 78.0% ] 77.75% | 4,728,922 | $57,432 |
[ 78.0% - 78.5% ] 78.26% | 4,764,150 | $54,138 |
[ 78.5% - 79.0% ] 78.74% | 4,804,724 | $58,926 |
[ 79.0% - 79.5% ] 79.24% | 4,396,621 | $57,766 |
[ 79.5% - 80.0% ] 79.75% | 4,257,327 | $60,338 |
[ 80.0% - 80.5% ] 80.25% | 4,185,309 | $62,517 |
[ 80.5% - 81.0% ] 80.75% | 5,620,371 | $56,720 |
[ 81.0% - 81.5% ] 81.26% | 5,327,573 | $58,377 |
[ 81.5% - 82.0% ] 81.77% | 5,647,291 | $54,090 |
[ 82.0% - 82.5% ] 82.25% | 4,533,457 | $59,045 |
[ 82.5% - 83.0% ] 82.75% | 5,021,475 | $59,181 |
[ 83.0% - 83.5% ] 83.25% | 5,107,948 | $58,900 |
[ 83.5% - 84.0% ] 83.75% | 5,387,893 | $58,211 |
[ 84.0% - 84.5% ] 84.25% | 4,697,901 | $60,035 |
[ 84.5% - 85.0% ] 84.75% | 5,019,541 | $56,340 |
[ 85.0% - 85.5% ] 85.23% | 5,770,313 | $56,618 |
[ 85.5% - 86.0% ] 85.76% | 5,137,806 | $56,963 |
[ 86.0% - 86.5% ] 86.25% | 4,867,138 | $56,118 |
[ 86.5% - 87.0% ] 86.74% | 5,407,658 | $57,799 |
[ 87.0% - 87.5% ] 87.26% | 5,303,527 | $56,243 |
[ 87.5% - 88.0% ] 87.75% | 5,289,886 | $57,469 |
[ 88.0% - 88.5% ] 88.26% | 5,541,039 | $55,828 |
[ 88.5% - 89.0% ] 88.75% | 5,360,414 | $55,819 |
[ 89.0% - 89.5% ] 89.25% | 4,702,908 | $55,176 |
[ 89.5% - 90.0% ] 89.75% | 4,536,416 | $55,767 |
[ 90.0% - 90.5% ] 90.25% | 4,317,947 | $54,113 |
[ 90.5% - 91.0% ] 90.76% | 5,219,925 | $55,458 |
[ 91.0% - 91.5% ] 91.25% | 5,627,203 | $55,921 |
[ 91.5% - 92.0% ] 91.75% | 4,483,791 | $53,802 |
[ 92.0% - 92.5% ] 92.25% | 5,242,956 | $53,414 |
[ 92.5% - 93.0% ] 92.75% | 4,866,094 | $52,144 |
[ 93.0% - 93.5% ] 93.24% | 4,746,601 | $52,424 |
[ 93.5% - 94.0% ] 93.75% | 4,247,787 | $53,647 |
[ 94.0% - 94.5% ] 94.25% | 4,484,126 | $52,310 |
[ 94.5% - 95.0% ] 94.75% | 4,461,254 | $51,171 |
[ 95.0% - 95.5% ] 95.26% | 3,785,153 | $51,983 |
[ 95.5% - 96.0% ] 95.76% | 3,395,263 | $50,104 |
[ 96.0% - 96.5% ] 96.25% | 3,007,550 | $49,846 |
[ 96.5% - 97.0% ] 96.75% | 2,657,289 | $50,368 |
[ 97.0% - 97.5% ] 97.25% | 2,282,172 | $48,609 |
[ 97.5% - 98.0% ] 97.74% | 2,021,168 | $50,594 |
[ 98.0% - 98.5% ] 98.25% | 1,479,513 | $51,083 |
[ 98.5% - 99.0% ] 98.73% | 1,134,263 | $49,190 |
[ 99.0% - 99.5% ] 99.24% | 679,953 | $48,543 |
[ 99.5% - 100.0% ] 99.91% | 1,280,031 | $53,821 |