Guamanian/Chamorro vs Immigrants from Bolivia Median Male Earnings
COMPARE
Guamanian/Chamorro
Immigrants from Bolivia
Median Male Earnings
Median Male Earnings Comparison
Guamanians/Chamorros
Immigrants from Bolivia
$53,661
MEDIAN MALE EARNINGS
30.7/ 100
METRIC RATING
191st/ 347
METRIC RANK
$60,088
MEDIAN MALE EARNINGS
99.6/ 100
METRIC RATING
75th/ 347
METRIC RANK
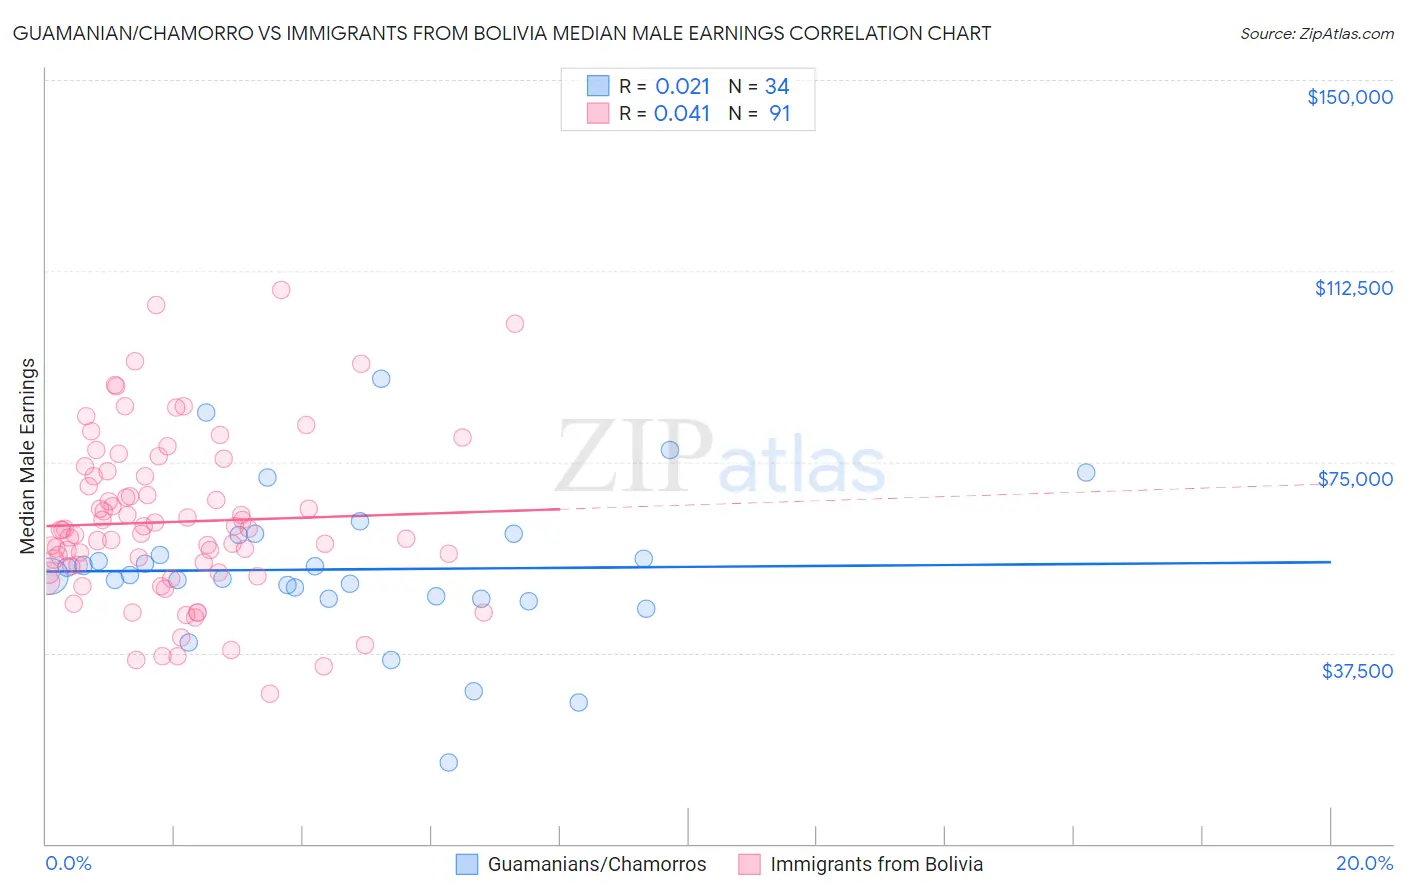
Guamanian/Chamorro vs Immigrants from Bolivia Median Male Earnings Correlation Chart
The statistical analysis conducted on geographies consisting of 221,944,725 people shows no correlation between the proportion of Guamanians/Chamorros and median male earnings in the United States with a correlation coefficient (R) of 0.021 and weighted average of $53,661. Similarly, the statistical analysis conducted on geographies consisting of 158,704,796 people shows no correlation between the proportion of Immigrants from Bolivia and median male earnings in the United States with a correlation coefficient (R) of 0.041 and weighted average of $60,088, a difference of 12.0%.
Median Male Earnings Correlation Summary
| Measurement | Guamanian/Chamorro | Immigrants from Bolivia |
| Minimum | $15,938 | $29,412 |
| Maximum | $91,265 | $108,819 |
| Range | $75,327 | $79,407 |
| Mean | $53,880 | $63,204 |
| Median | $52,699 | $61,601 |
| Interquartile 25% (IQ1) | $48,166 | $53,242 |
| Interquartile 75% (IQ3) | $60,575 | $72,136 |
| Interquartile Range (IQR) | $12,408 | $18,895 |
| Standard Deviation (Sample) | $14,873 | $16,071 |
| Standard Deviation (Population) | $14,653 | $15,982 |
Similar Demographics by Median Male Earnings
Demographics Similar to Guamanians/Chamorros by Median Male Earnings
In terms of median male earnings, the demographic groups most similar to Guamanians/Chamorros are Scotch-Irish ($53,658, a difference of 0.010%), Kenyan ($53,647, a difference of 0.030%), Uruguayan ($53,680, a difference of 0.040%), Puget Sound Salish ($53,704, a difference of 0.080%), and Immigrants from Eritrea ($53,715, a difference of 0.10%).
| Demographics | Rating | Rank | Median Male Earnings |
| Whites/Caucasians | 36.5 /100 | #184 | Fair $53,925 |
| Immigrants | Sierra Leone | 36.0 /100 | #185 | Fair $53,905 |
| Colombians | 34.4 /100 | #186 | Fair $53,832 |
| Immigrants | Eritrea | 31.8 /100 | #187 | Fair $53,715 |
| Immigrants | Eastern Africa | 31.8 /100 | #188 | Fair $53,713 |
| Puget Sound Salish | 31.6 /100 | #189 | Fair $53,704 |
| Uruguayans | 31.1 /100 | #190 | Fair $53,680 |
| Guamanians/Chamorros | 30.7 /100 | #191 | Fair $53,661 |
| Scotch-Irish | 30.6 /100 | #192 | Fair $53,658 |
| Kenyans | 30.4 /100 | #193 | Fair $53,647 |
| Spanish | 29.0 /100 | #194 | Fair $53,576 |
| Immigrants | Azores | 27.5 /100 | #195 | Fair $53,503 |
| Immigrants | Africa | 26.6 /100 | #196 | Fair $53,457 |
| Immigrants | Kenya | 26.0 /100 | #197 | Fair $53,427 |
| Immigrants | Costa Rica | 22.6 /100 | #198 | Fair $53,237 |
Demographics Similar to Immigrants from Bolivia by Median Male Earnings
In terms of median male earnings, the demographic groups most similar to Immigrants from Bolivia are Romanian ($60,063, a difference of 0.040%), Argentinean ($60,117, a difference of 0.050%), Paraguayan ($59,975, a difference of 0.19%), Immigrants from Egypt ($59,925, a difference of 0.27%), and Immigrants from North America ($60,265, a difference of 0.29%).
| Demographics | Rating | Rank | Median Male Earnings |
| Immigrants | Serbia | 99.7 /100 | #68 | Exceptional $60,600 |
| Immigrants | Canada | 99.7 /100 | #69 | Exceptional $60,388 |
| Immigrants | Bulgaria | 99.7 /100 | #70 | Exceptional $60,358 |
| Mongolians | 99.7 /100 | #71 | Exceptional $60,350 |
| Immigrants | Western Europe | 99.7 /100 | #72 | Exceptional $60,334 |
| Immigrants | North America | 99.7 /100 | #73 | Exceptional $60,265 |
| Argentineans | 99.6 /100 | #74 | Exceptional $60,117 |
| Immigrants | Bolivia | 99.6 /100 | #75 | Exceptional $60,088 |
| Romanians | 99.6 /100 | #76 | Exceptional $60,063 |
| Paraguayans | 99.5 /100 | #77 | Exceptional $59,975 |
| Immigrants | Egypt | 99.5 /100 | #78 | Exceptional $59,925 |
| Immigrants | Ukraine | 99.5 /100 | #79 | Exceptional $59,820 |
| Immigrants | Hungary | 99.5 /100 | #80 | Exceptional $59,806 |
| Ukrainians | 99.4 /100 | #81 | Exceptional $59,728 |
| Croatians | 99.4 /100 | #82 | Exceptional $59,715 |