Guamanian/Chamorro vs Tlingit-Haida Median Male Earnings
COMPARE
Guamanian/Chamorro
Tlingit-Haida
Median Male Earnings
Median Male Earnings Comparison
Guamanians/Chamorros
Tlingit-Haida
$53,661
MEDIAN MALE EARNINGS
30.7/ 100
METRIC RATING
191st/ 347
METRIC RANK
$52,409
MEDIAN MALE EARNINGS
11.5/ 100
METRIC RATING
211th/ 347
METRIC RANK
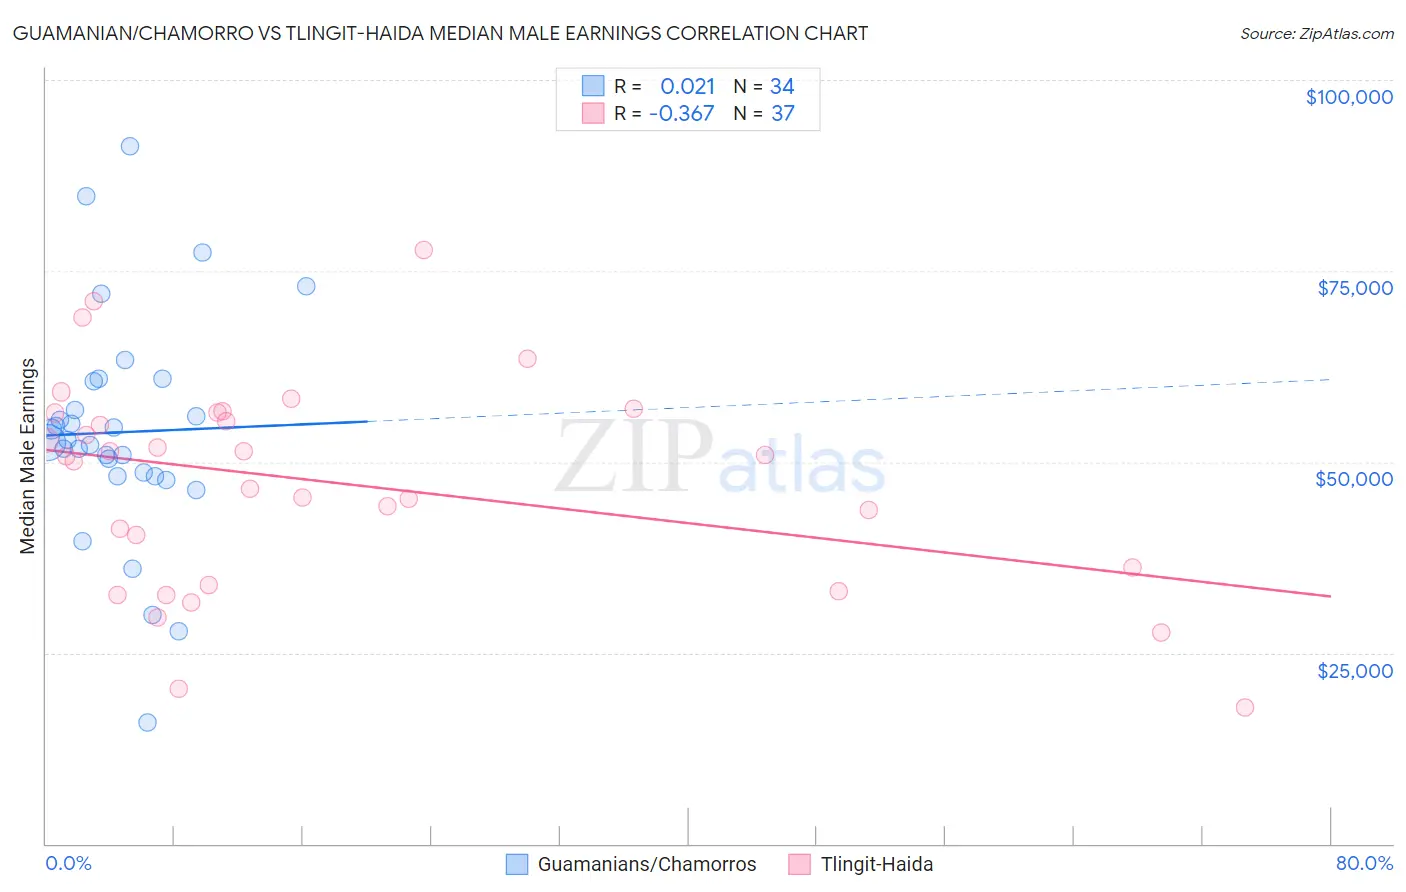
Guamanian/Chamorro vs Tlingit-Haida Median Male Earnings Correlation Chart
The statistical analysis conducted on geographies consisting of 221,944,725 people shows no correlation between the proportion of Guamanians/Chamorros and median male earnings in the United States with a correlation coefficient (R) of 0.021 and weighted average of $53,661. Similarly, the statistical analysis conducted on geographies consisting of 60,863,896 people shows a mild negative correlation between the proportion of Tlingit-Haida and median male earnings in the United States with a correlation coefficient (R) of -0.367 and weighted average of $52,409, a difference of 2.4%.
Median Male Earnings Correlation Summary
| Measurement | Guamanian/Chamorro | Tlingit-Haida |
| Minimum | $15,938 | $17,917 |
| Maximum | $91,265 | $77,679 |
| Range | $75,327 | $59,762 |
| Mean | $53,880 | $47,277 |
| Median | $52,699 | $50,705 |
| Interquartile 25% (IQ1) | $48,166 | $35,036 |
| Interquartile 75% (IQ3) | $60,575 | $56,386 |
| Interquartile Range (IQR) | $12,408 | $21,350 |
| Standard Deviation (Sample) | $14,873 | $13,635 |
| Standard Deviation (Population) | $14,653 | $13,450 |
Demographics Similar to Guamanians/Chamorros and Tlingit-Haida by Median Male Earnings
In terms of median male earnings, the demographic groups most similar to Guamanians/Chamorros are Scotch-Irish ($53,658, a difference of 0.010%), Kenyan ($53,647, a difference of 0.030%), Spanish ($53,576, a difference of 0.16%), Immigrants from the Azores ($53,503, a difference of 0.30%), and Immigrants from Africa ($53,457, a difference of 0.38%). Similarly, the demographic groups most similar to Tlingit-Haida are Delaware ($52,412, a difference of 0.010%), Bermudan ($52,465, a difference of 0.11%), Venezuelan ($52,510, a difference of 0.19%), Vietnamese ($52,525, a difference of 0.22%), and Immigrants from Iraq ($52,681, a difference of 0.52%).
| Demographics | Rating | Rank | Median Male Earnings |
| Guamanians/Chamorros | 30.7 /100 | #191 | Fair $53,661 |
| Scotch-Irish | 30.6 /100 | #192 | Fair $53,658 |
| Kenyans | 30.4 /100 | #193 | Fair $53,647 |
| Spanish | 29.0 /100 | #194 | Fair $53,576 |
| Immigrants | Azores | 27.5 /100 | #195 | Fair $53,503 |
| Immigrants | Africa | 26.6 /100 | #196 | Fair $53,457 |
| Immigrants | Kenya | 26.0 /100 | #197 | Fair $53,427 |
| Immigrants | Costa Rica | 22.6 /100 | #198 | Fair $53,237 |
| Tongans | 22.3 /100 | #199 | Fair $53,218 |
| Immigrants | Thailand | 17.5 /100 | #200 | Poor $52,908 |
| Immigrants | Bosnia and Herzegovina | 16.9 /100 | #201 | Poor $52,869 |
| Immigrants | Uruguay | 16.8 /100 | #202 | Poor $52,860 |
| Panamanians | 16.5 /100 | #203 | Poor $52,835 |
| Ghanaians | 16.1 /100 | #204 | Poor $52,810 |
| Immigrants | Colombia | 15.0 /100 | #205 | Poor $52,725 |
| Immigrants | Iraq | 14.5 /100 | #206 | Poor $52,681 |
| Vietnamese | 12.7 /100 | #207 | Poor $52,525 |
| Venezuelans | 12.5 /100 | #208 | Poor $52,510 |
| Bermudans | 12.1 /100 | #209 | Poor $52,465 |
| Delaware | 11.5 /100 | #210 | Poor $52,412 |
| Tlingit-Haida | 11.5 /100 | #211 | Poor $52,409 |