Guamanian/Chamorro vs Immigrants from Saudi Arabia Median Male Earnings
COMPARE
Guamanian/Chamorro
Immigrants from Saudi Arabia
Median Male Earnings
Median Male Earnings Comparison
Guamanians/Chamorros
Immigrants from Saudi Arabia
$53,661
MEDIAN MALE EARNINGS
30.7/ 100
METRIC RATING
191st/ 347
METRIC RANK
$56,452
MEDIAN MALE EARNINGS
87.2/ 100
METRIC RATING
136th/ 347
METRIC RANK
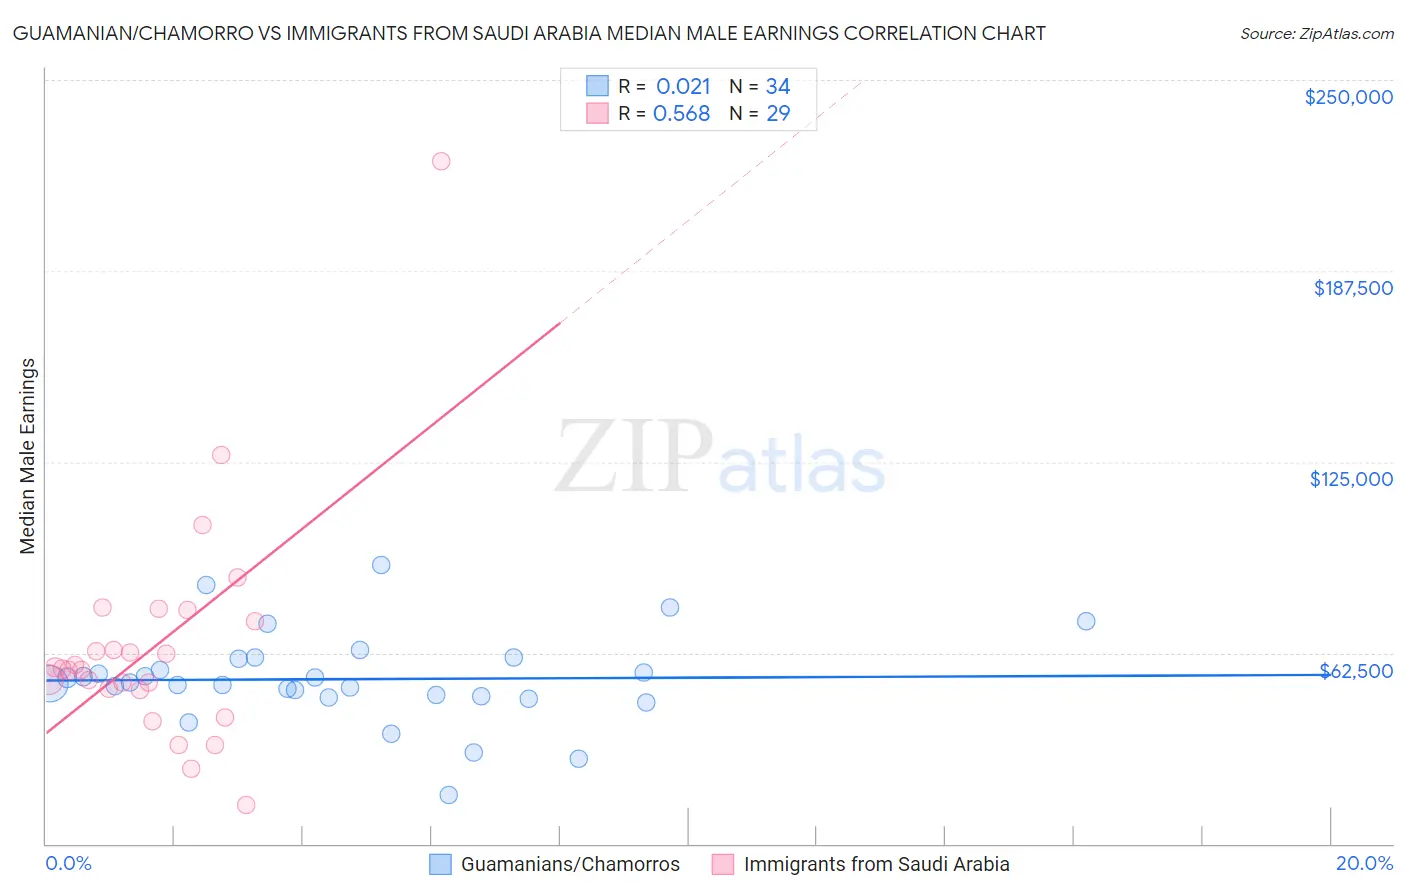
Guamanian/Chamorro vs Immigrants from Saudi Arabia Median Male Earnings Correlation Chart
The statistical analysis conducted on geographies consisting of 221,944,725 people shows no correlation between the proportion of Guamanians/Chamorros and median male earnings in the United States with a correlation coefficient (R) of 0.021 and weighted average of $53,661. Similarly, the statistical analysis conducted on geographies consisting of 164,293,936 people shows a substantial positive correlation between the proportion of Immigrants from Saudi Arabia and median male earnings in the United States with a correlation coefficient (R) of 0.568 and weighted average of $56,452, a difference of 5.2%.
Median Male Earnings Correlation Summary
| Measurement | Guamanian/Chamorro | Immigrants from Saudi Arabia |
| Minimum | $15,938 | $12,696 |
| Maximum | $91,265 | $223,261 |
| Range | $75,327 | $210,565 |
| Mean | $53,880 | $64,851 |
| Median | $52,699 | $57,085 |
| Interquartile 25% (IQ1) | $48,166 | $50,362 |
| Interquartile 75% (IQ3) | $60,575 | $74,807 |
| Interquartile Range (IQR) | $12,408 | $24,445 |
| Standard Deviation (Sample) | $14,873 | $38,008 |
| Standard Deviation (Population) | $14,653 | $37,347 |
Similar Demographics by Median Male Earnings
Demographics Similar to Guamanians/Chamorros by Median Male Earnings
In terms of median male earnings, the demographic groups most similar to Guamanians/Chamorros are Scotch-Irish ($53,658, a difference of 0.010%), Kenyan ($53,647, a difference of 0.030%), Uruguayan ($53,680, a difference of 0.040%), Puget Sound Salish ($53,704, a difference of 0.080%), and Immigrants from Eritrea ($53,715, a difference of 0.10%).
| Demographics | Rating | Rank | Median Male Earnings |
| Whites/Caucasians | 36.5 /100 | #184 | Fair $53,925 |
| Immigrants | Sierra Leone | 36.0 /100 | #185 | Fair $53,905 |
| Colombians | 34.4 /100 | #186 | Fair $53,832 |
| Immigrants | Eritrea | 31.8 /100 | #187 | Fair $53,715 |
| Immigrants | Eastern Africa | 31.8 /100 | #188 | Fair $53,713 |
| Puget Sound Salish | 31.6 /100 | #189 | Fair $53,704 |
| Uruguayans | 31.1 /100 | #190 | Fair $53,680 |
| Guamanians/Chamorros | 30.7 /100 | #191 | Fair $53,661 |
| Scotch-Irish | 30.6 /100 | #192 | Fair $53,658 |
| Kenyans | 30.4 /100 | #193 | Fair $53,647 |
| Spanish | 29.0 /100 | #194 | Fair $53,576 |
| Immigrants | Azores | 27.5 /100 | #195 | Fair $53,503 |
| Immigrants | Africa | 26.6 /100 | #196 | Fair $53,457 |
| Immigrants | Kenya | 26.0 /100 | #197 | Fair $53,427 |
| Immigrants | Costa Rica | 22.6 /100 | #198 | Fair $53,237 |
Demographics Similar to Immigrants from Saudi Arabia by Median Male Earnings
In terms of median male earnings, the demographic groups most similar to Immigrants from Saudi Arabia are Irish ($56,464, a difference of 0.020%), Moroccan ($56,499, a difference of 0.080%), Slavic ($56,390, a difference of 0.11%), Immigrants from Germany ($56,542, a difference of 0.16%), and Czech ($56,546, a difference of 0.17%).
| Demographics | Rating | Rank | Median Male Earnings |
| Pakistanis | 89.9 /100 | #129 | Excellent $56,719 |
| Koreans | 89.4 /100 | #130 | Excellent $56,672 |
| Portuguese | 89.4 /100 | #131 | Excellent $56,663 |
| Czechs | 88.2 /100 | #132 | Excellent $56,546 |
| Immigrants | Germany | 88.2 /100 | #133 | Excellent $56,542 |
| Moroccans | 87.7 /100 | #134 | Excellent $56,499 |
| Irish | 87.4 /100 | #135 | Excellent $56,464 |
| Immigrants | Saudi Arabia | 87.2 /100 | #136 | Excellent $56,452 |
| Slavs | 86.5 /100 | #137 | Excellent $56,390 |
| Slovaks | 85.5 /100 | #138 | Excellent $56,306 |
| Zimbabweans | 85.5 /100 | #139 | Excellent $56,302 |
| Luxembourgers | 85.5 /100 | #140 | Excellent $56,300 |
| Danes | 84.8 /100 | #141 | Excellent $56,246 |
| Ethiopians | 84.8 /100 | #142 | Excellent $56,243 |
| Sri Lankans | 83.4 /100 | #143 | Excellent $56,136 |