Cherokee vs Czechoslovakian College, Under 1 year
COMPARE
Cherokee
Czechoslovakian
College, Under 1 year
College, Under 1 year Comparison
Cherokee
Czechoslovakians
60.1%
COLLEGE, UNDER 1 YEAR
0.1/ 100
METRIC RATING
281st/ 347
METRIC RANK
65.8%
COLLEGE, UNDER 1 YEAR
62.6/ 100
METRIC RATING
164th/ 347
METRIC RANK
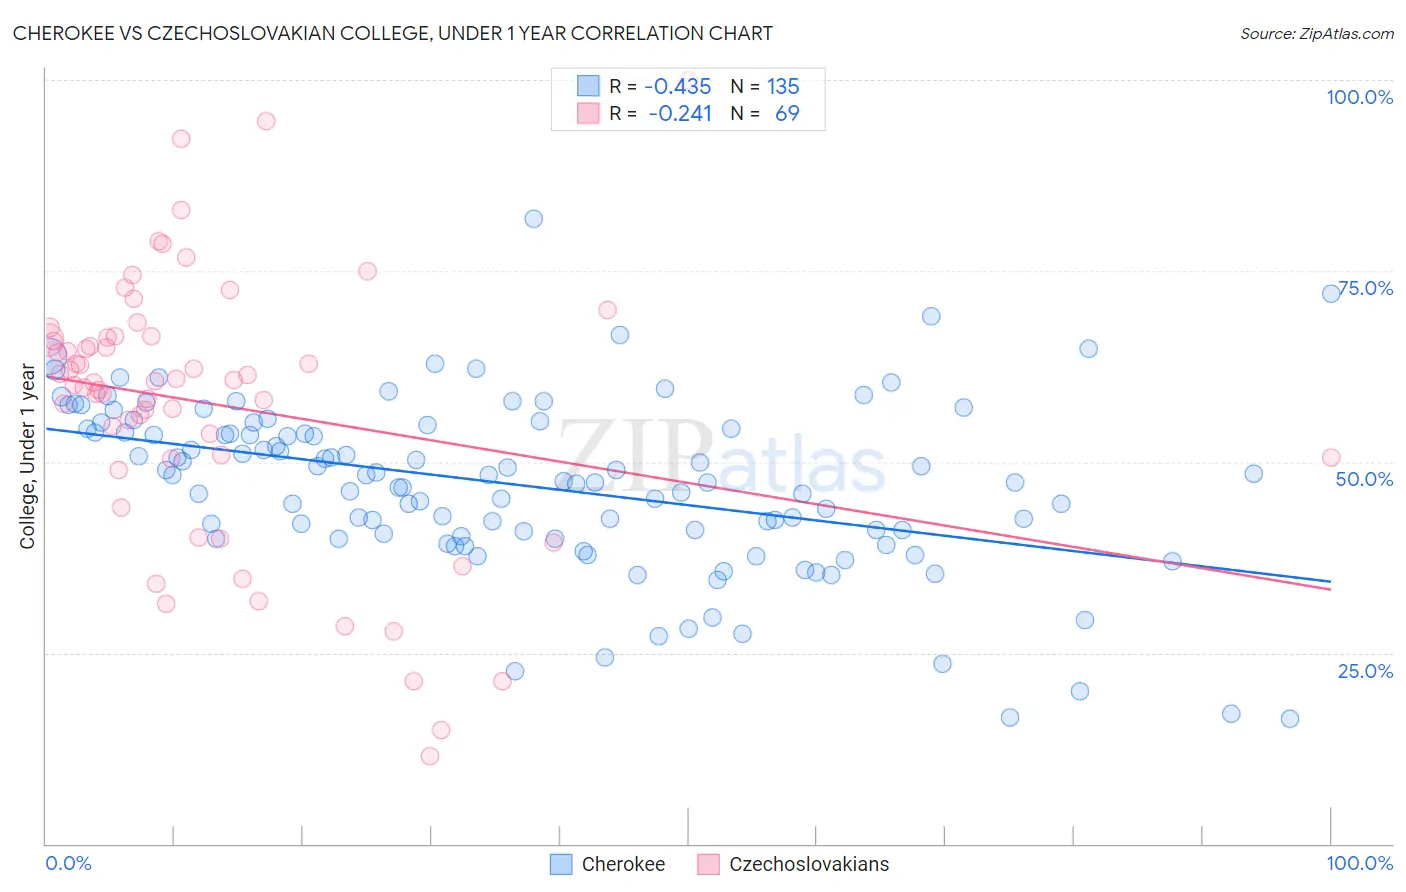
Cherokee vs Czechoslovakian College, Under 1 year Correlation Chart
The statistical analysis conducted on geographies consisting of 493,717,865 people shows a moderate negative correlation between the proportion of Cherokee and percentage of population with at least college, under 1 year education in the United States with a correlation coefficient (R) of -0.435 and weighted average of 60.1%. Similarly, the statistical analysis conducted on geographies consisting of 368,667,204 people shows a weak negative correlation between the proportion of Czechoslovakians and percentage of population with at least college, under 1 year education in the United States with a correlation coefficient (R) of -0.241 and weighted average of 65.8%, a difference of 9.4%.
College, Under 1 year Correlation Summary
| Measurement | Cherokee | Czechoslovakian |
| Minimum | 16.3% | 11.5% |
| Maximum | 81.8% | 100.0% |
| Range | 65.5% | 88.5% |
| Mean | 46.9% | 57.6% |
| Median | 47.4% | 60.6% |
| Interquartile 25% (IQ1) | 40.3% | 50.4% |
| Interquartile 75% (IQ3) | 54.4% | 66.4% |
| Interquartile Range (IQR) | 14.2% | 15.9% |
| Standard Deviation (Sample) | 11.2% | 17.7% |
| Standard Deviation (Population) | 11.2% | 17.6% |
Similar Demographics by College, Under 1 year
Demographics Similar to Cherokee by College, Under 1 year
In terms of college, under 1 year, the demographic groups most similar to Cherokee are Belizean (60.1%, a difference of 0.040%), Crow (60.2%, a difference of 0.11%), Ute (60.2%, a difference of 0.20%), Yaqui (60.2%, a difference of 0.21%), and Bahamian (60.3%, a difference of 0.25%).
| Demographics | Rating | Rank | College, Under 1 year |
| Alaska Natives | 0.1 /100 | #274 | Tragic 60.4% |
| Immigrants | Barbados | 0.1 /100 | #275 | Tragic 60.4% |
| Arapaho | 0.1 /100 | #276 | Tragic 60.3% |
| Bahamians | 0.1 /100 | #277 | Tragic 60.3% |
| Yaqui | 0.1 /100 | #278 | Tragic 60.2% |
| Ute | 0.1 /100 | #279 | Tragic 60.2% |
| Crow | 0.1 /100 | #280 | Tragic 60.2% |
| Cherokee | 0.1 /100 | #281 | Tragic 60.1% |
| Belizeans | 0.1 /100 | #282 | Tragic 60.1% |
| Immigrants | Jamaica | 0.0 /100 | #283 | Tragic 59.7% |
| Immigrants | St. Vincent and the Grenadines | 0.0 /100 | #284 | Tragic 59.6% |
| Paiute | 0.0 /100 | #285 | Tragic 59.6% |
| British West Indians | 0.0 /100 | #286 | Tragic 59.5% |
| Sioux | 0.0 /100 | #287 | Tragic 59.4% |
| Blacks/African Americans | 0.0 /100 | #288 | Tragic 59.4% |
Demographics Similar to Czechoslovakians by College, Under 1 year
In terms of college, under 1 year, the demographic groups most similar to Czechoslovakians are Somali (65.8%, a difference of 0.010%), Immigrants from Uzbekistan (65.8%, a difference of 0.050%), Korean (65.9%, a difference of 0.13%), Brazilian (65.9%, a difference of 0.16%), and Albanian (65.9%, a difference of 0.17%).
| Demographics | Rating | Rank | College, Under 1 year |
| Sierra Leoneans | 67.8 /100 | #157 | Good 66.0% |
| Celtics | 67.3 /100 | #158 | Good 65.9% |
| Tlingit-Haida | 66.4 /100 | #159 | Good 65.9% |
| Albanians | 66.1 /100 | #160 | Good 65.9% |
| Brazilians | 66.0 /100 | #161 | Good 65.9% |
| Koreans | 65.3 /100 | #162 | Good 65.9% |
| Somalis | 62.7 /100 | #163 | Good 65.8% |
| Czechoslovakians | 62.6 /100 | #164 | Good 65.8% |
| Immigrants | Uzbekistan | 61.6 /100 | #165 | Good 65.8% |
| Moroccans | 56.7 /100 | #166 | Average 65.6% |
| Immigrants | Somalia | 56.4 /100 | #167 | Average 65.6% |
| Hungarians | 55.9 /100 | #168 | Average 65.6% |
| Yugoslavians | 55.7 /100 | #169 | Average 65.6% |
| Germans | 55.7 /100 | #170 | Average 65.6% |
| Immigrants | Oceania | 55.0 /100 | #171 | Average 65.6% |