Cherokee vs Indonesian College, Under 1 year
COMPARE
Cherokee
Indonesian
College, Under 1 year
College, Under 1 year Comparison
Cherokee
Indonesians
60.1%
COLLEGE, UNDER 1 YEAR
0.1/ 100
METRIC RATING
281st/ 347
METRIC RANK
61.2%
COLLEGE, UNDER 1 YEAR
0.3/ 100
METRIC RATING
259th/ 347
METRIC RANK
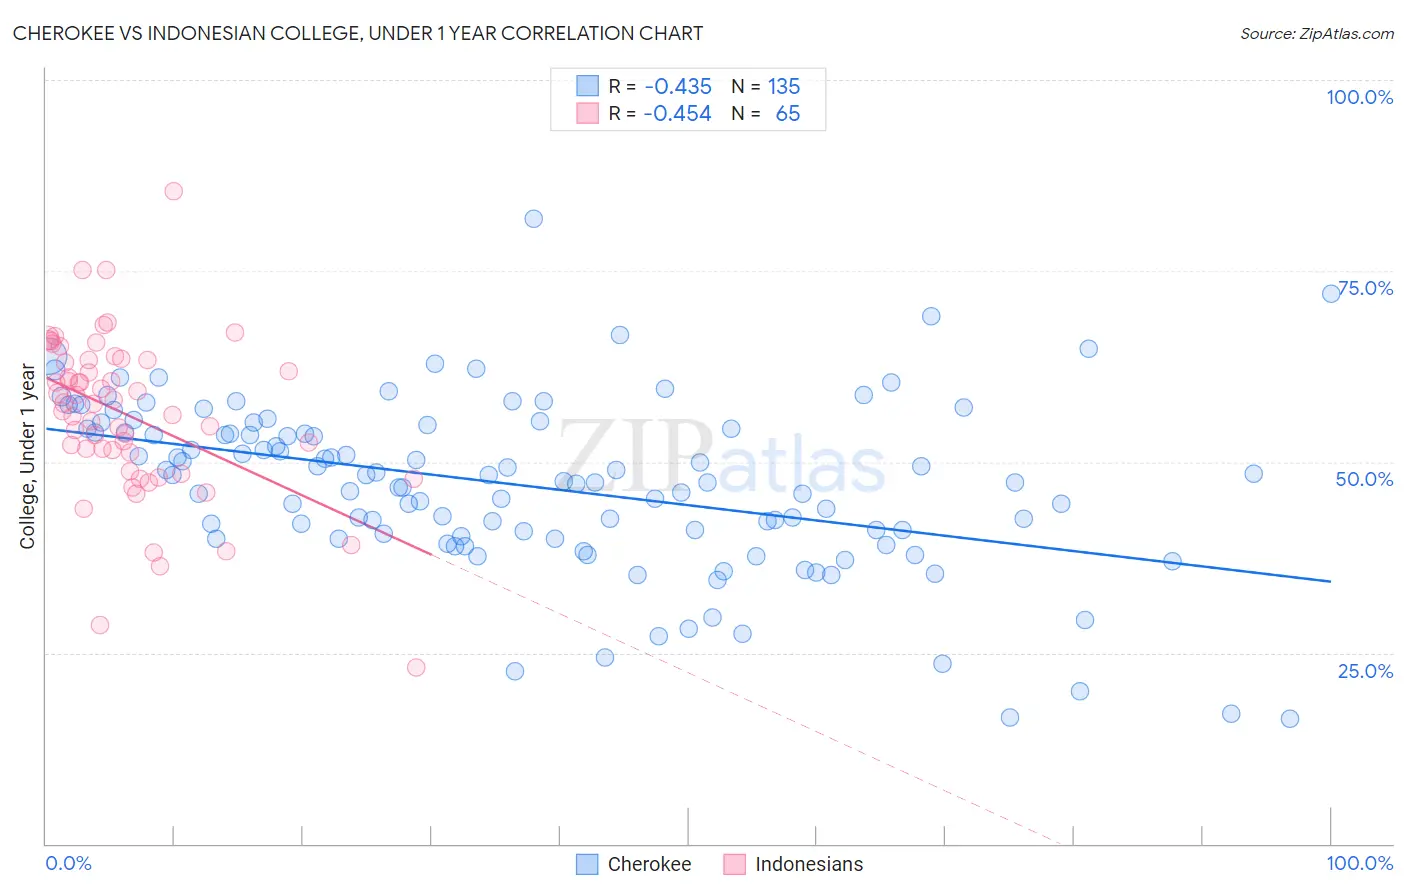
Cherokee vs Indonesian College, Under 1 year Correlation Chart
The statistical analysis conducted on geographies consisting of 493,717,865 people shows a moderate negative correlation between the proportion of Cherokee and percentage of population with at least college, under 1 year education in the United States with a correlation coefficient (R) of -0.435 and weighted average of 60.1%. Similarly, the statistical analysis conducted on geographies consisting of 162,726,213 people shows a moderate negative correlation between the proportion of Indonesians and percentage of population with at least college, under 1 year education in the United States with a correlation coefficient (R) of -0.454 and weighted average of 61.2%, a difference of 1.9%.
College, Under 1 year Correlation Summary
| Measurement | Cherokee | Indonesian |
| Minimum | 16.3% | 23.1% |
| Maximum | 81.8% | 85.5% |
| Range | 65.5% | 62.4% |
| Mean | 46.9% | 56.1% |
| Median | 47.4% | 57.6% |
| Interquartile 25% (IQ1) | 40.3% | 50.0% |
| Interquartile 75% (IQ3) | 54.4% | 63.3% |
| Interquartile Range (IQR) | 14.2% | 13.3% |
| Standard Deviation (Sample) | 11.2% | 10.7% |
| Standard Deviation (Population) | 11.2% | 10.6% |
Similar Demographics by College, Under 1 year
Demographics Similar to Cherokee by College, Under 1 year
In terms of college, under 1 year, the demographic groups most similar to Cherokee are Belizean (60.1%, a difference of 0.040%), Crow (60.2%, a difference of 0.11%), Ute (60.2%, a difference of 0.20%), Yaqui (60.2%, a difference of 0.21%), and Bahamian (60.3%, a difference of 0.25%).
| Demographics | Rating | Rank | College, Under 1 year |
| Alaska Natives | 0.1 /100 | #274 | Tragic 60.4% |
| Immigrants | Barbados | 0.1 /100 | #275 | Tragic 60.4% |
| Arapaho | 0.1 /100 | #276 | Tragic 60.3% |
| Bahamians | 0.1 /100 | #277 | Tragic 60.3% |
| Yaqui | 0.1 /100 | #278 | Tragic 60.2% |
| Ute | 0.1 /100 | #279 | Tragic 60.2% |
| Crow | 0.1 /100 | #280 | Tragic 60.2% |
| Cherokee | 0.1 /100 | #281 | Tragic 60.1% |
| Belizeans | 0.1 /100 | #282 | Tragic 60.1% |
| Immigrants | Jamaica | 0.0 /100 | #283 | Tragic 59.7% |
| Immigrants | St. Vincent and the Grenadines | 0.0 /100 | #284 | Tragic 59.6% |
| Paiute | 0.0 /100 | #285 | Tragic 59.6% |
| British West Indians | 0.0 /100 | #286 | Tragic 59.5% |
| Sioux | 0.0 /100 | #287 | Tragic 59.4% |
| Blacks/African Americans | 0.0 /100 | #288 | Tragic 59.4% |
Demographics Similar to Indonesians by College, Under 1 year
In terms of college, under 1 year, the demographic groups most similar to Indonesians are Immigrants from Bangladesh (61.3%, a difference of 0.020%), Immigrants from Laos (61.3%, a difference of 0.080%), Blackfeet (61.1%, a difference of 0.17%), Bangladeshi (61.4%, a difference of 0.20%), and African (61.1%, a difference of 0.20%).
| Demographics | Rating | Rank | College, Under 1 year |
| West Indians | 0.4 /100 | #252 | Tragic 61.5% |
| Japanese | 0.4 /100 | #253 | Tragic 61.5% |
| Immigrants | Cambodia | 0.4 /100 | #254 | Tragic 61.5% |
| Comanche | 0.4 /100 | #255 | Tragic 61.4% |
| Bangladeshis | 0.4 /100 | #256 | Tragic 61.4% |
| Immigrants | Laos | 0.3 /100 | #257 | Tragic 61.3% |
| Immigrants | Bangladesh | 0.3 /100 | #258 | Tragic 61.3% |
| Indonesians | 0.3 /100 | #259 | Tragic 61.2% |
| Blackfeet | 0.3 /100 | #260 | Tragic 61.1% |
| Africans | 0.3 /100 | #261 | Tragic 61.1% |
| Barbadians | 0.2 /100 | #262 | Tragic 61.1% |
| Shoshone | 0.2 /100 | #263 | Tragic 61.1% |
| Trinidadians and Tobagonians | 0.2 /100 | #264 | Tragic 61.1% |
| Immigrants | Bahamas | 0.2 /100 | #265 | Tragic 61.1% |
| Alaskan Athabascans | 0.2 /100 | #266 | Tragic 61.0% |