Cherokee vs Senegalese College, Under 1 year
COMPARE
Cherokee
Senegalese
College, Under 1 year
College, Under 1 year Comparison
Cherokee
Senegalese
60.1%
COLLEGE, UNDER 1 YEAR
0.1/ 100
METRIC RATING
281st/ 347
METRIC RANK
63.6%
COLLEGE, UNDER 1 YEAR
7.7/ 100
METRIC RATING
215th/ 347
METRIC RANK
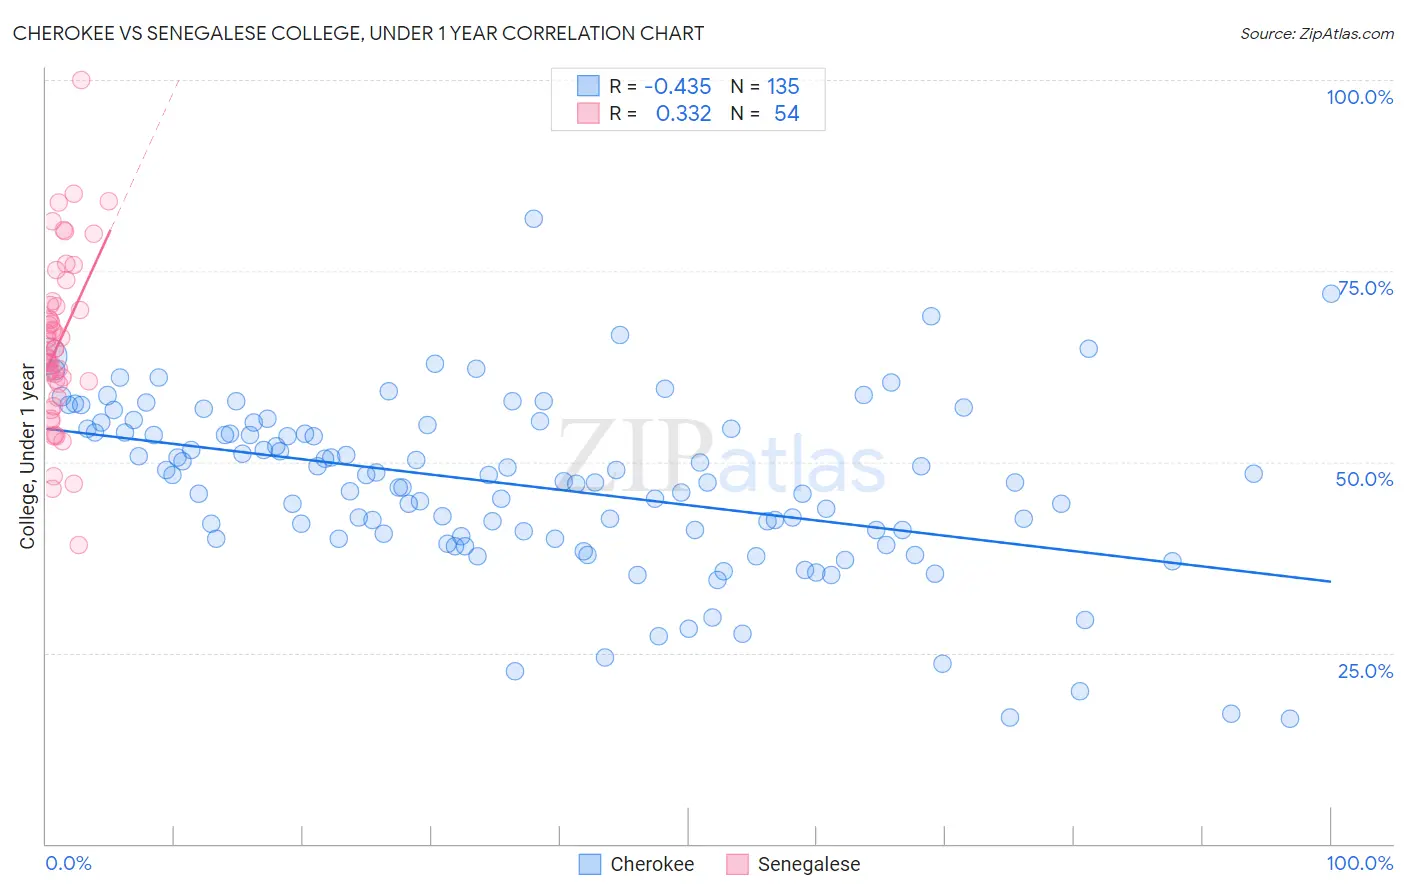
Cherokee vs Senegalese College, Under 1 year Correlation Chart
The statistical analysis conducted on geographies consisting of 493,717,865 people shows a moderate negative correlation between the proportion of Cherokee and percentage of population with at least college, under 1 year education in the United States with a correlation coefficient (R) of -0.435 and weighted average of 60.1%. Similarly, the statistical analysis conducted on geographies consisting of 78,142,569 people shows a mild positive correlation between the proportion of Senegalese and percentage of population with at least college, under 1 year education in the United States with a correlation coefficient (R) of 0.332 and weighted average of 63.6%, a difference of 5.9%.
College, Under 1 year Correlation Summary
| Measurement | Cherokee | Senegalese |
| Minimum | 16.3% | 39.1% |
| Maximum | 81.8% | 100.0% |
| Range | 65.5% | 60.9% |
| Mean | 46.9% | 65.6% |
| Median | 47.4% | 64.7% |
| Interquartile 25% (IQ1) | 40.3% | 60.2% |
| Interquartile 75% (IQ3) | 54.4% | 70.5% |
| Interquartile Range (IQR) | 14.2% | 10.4% |
| Standard Deviation (Sample) | 11.2% | 11.1% |
| Standard Deviation (Population) | 11.2% | 11.0% |
Similar Demographics by College, Under 1 year
Demographics Similar to Cherokee by College, Under 1 year
In terms of college, under 1 year, the demographic groups most similar to Cherokee are Belizean (60.1%, a difference of 0.040%), Crow (60.2%, a difference of 0.11%), Ute (60.2%, a difference of 0.20%), Yaqui (60.2%, a difference of 0.21%), and Bahamian (60.3%, a difference of 0.25%).
| Demographics | Rating | Rank | College, Under 1 year |
| Alaska Natives | 0.1 /100 | #274 | Tragic 60.4% |
| Immigrants | Barbados | 0.1 /100 | #275 | Tragic 60.4% |
| Arapaho | 0.1 /100 | #276 | Tragic 60.3% |
| Bahamians | 0.1 /100 | #277 | Tragic 60.3% |
| Yaqui | 0.1 /100 | #278 | Tragic 60.2% |
| Ute | 0.1 /100 | #279 | Tragic 60.2% |
| Crow | 0.1 /100 | #280 | Tragic 60.2% |
| Cherokee | 0.1 /100 | #281 | Tragic 60.1% |
| Belizeans | 0.1 /100 | #282 | Tragic 60.1% |
| Immigrants | Jamaica | 0.0 /100 | #283 | Tragic 59.7% |
| Immigrants | St. Vincent and the Grenadines | 0.0 /100 | #284 | Tragic 59.6% |
| Paiute | 0.0 /100 | #285 | Tragic 59.6% |
| British West Indians | 0.0 /100 | #286 | Tragic 59.5% |
| Sioux | 0.0 /100 | #287 | Tragic 59.4% |
| Blacks/African Americans | 0.0 /100 | #288 | Tragic 59.4% |
Demographics Similar to Senegalese by College, Under 1 year
In terms of college, under 1 year, the demographic groups most similar to Senegalese are Hmong (63.5%, a difference of 0.15%), Immigrants from Nigeria (63.7%, a difference of 0.17%), Immigrants from South America (63.8%, a difference of 0.21%), Immigrants from Uruguay (63.4%, a difference of 0.34%), and Immigrants from Panama (63.4%, a difference of 0.36%).
| Demographics | Rating | Rank | College, Under 1 year |
| Immigrants | Vietnam | 12.1 /100 | #208 | Poor 64.0% |
| Puget Sound Salish | 11.3 /100 | #209 | Poor 63.9% |
| Ghanaians | 11.2 /100 | #210 | Poor 63.9% |
| Native Hawaiians | 10.6 /100 | #211 | Poor 63.9% |
| Immigrants | Middle Africa | 10.5 /100 | #212 | Poor 63.9% |
| Immigrants | South America | 9.1 /100 | #213 | Tragic 63.8% |
| Immigrants | Nigeria | 8.8 /100 | #214 | Tragic 63.7% |
| Senegalese | 7.7 /100 | #215 | Tragic 63.6% |
| Hmong | 6.8 /100 | #216 | Tragic 63.5% |
| Immigrants | Uruguay | 5.8 /100 | #217 | Tragic 63.4% |
| Immigrants | Panama | 5.7 /100 | #218 | Tragic 63.4% |
| Immigrants | Fiji | 5.7 /100 | #219 | Tragic 63.4% |
| Portuguese | 5.6 /100 | #220 | Tragic 63.4% |
| Cree | 5.2 /100 | #221 | Tragic 63.3% |
| Immigrants | Senegal | 5.0 /100 | #222 | Tragic 63.3% |