Cherokee vs English College, Under 1 year
COMPARE
Cherokee
English
College, Under 1 year
College, Under 1 year Comparison
Cherokee
English
60.1%
COLLEGE, UNDER 1 YEAR
0.1/ 100
METRIC RATING
281st/ 347
METRIC RANK
66.6%
COLLEGE, UNDER 1 YEAR
82.9/ 100
METRIC RATING
142nd/ 347
METRIC RANK
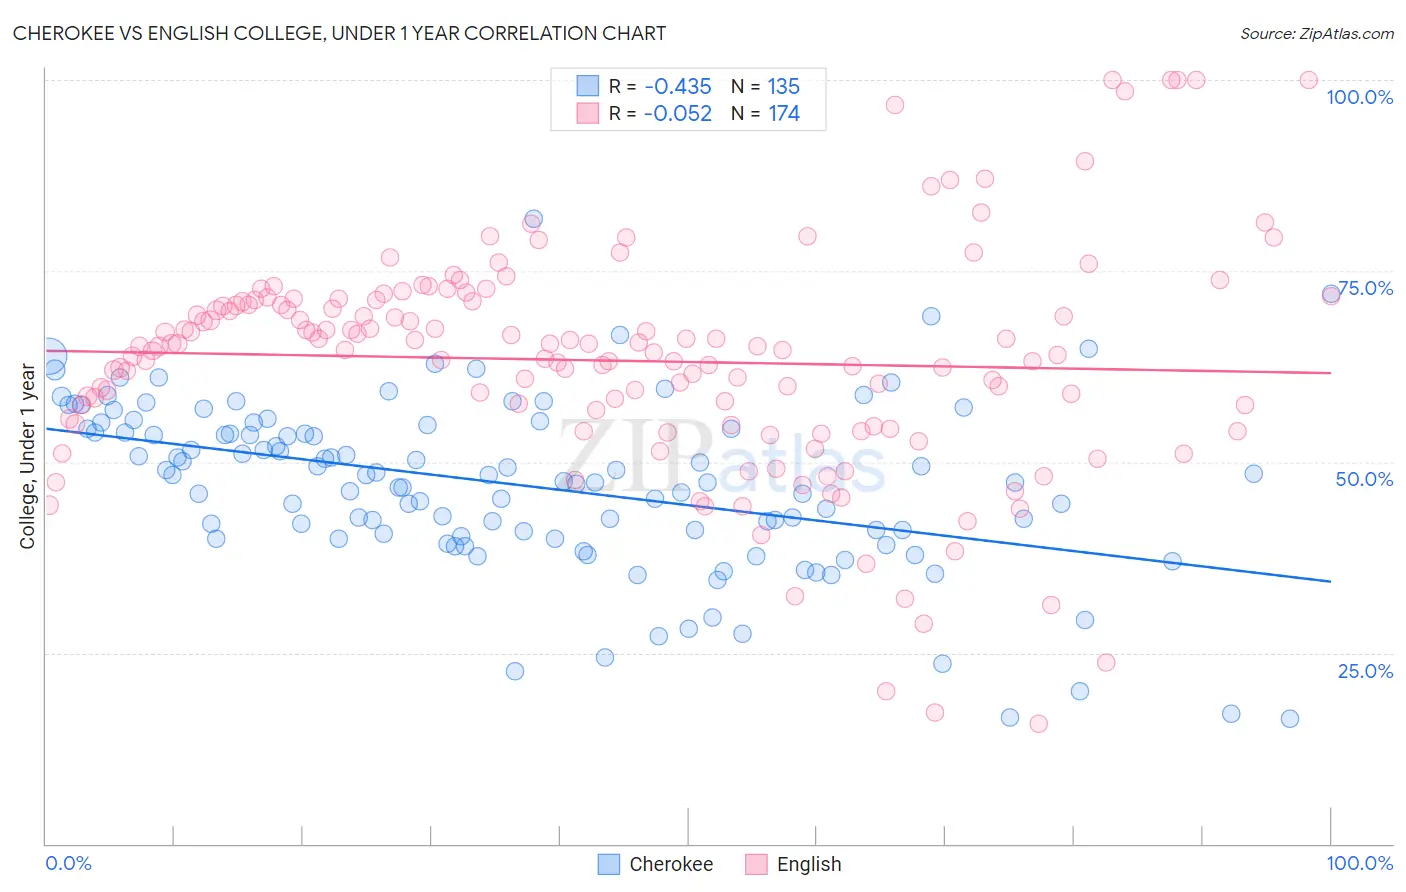
Cherokee vs English College, Under 1 year Correlation Chart
The statistical analysis conducted on geographies consisting of 493,717,865 people shows a moderate negative correlation between the proportion of Cherokee and percentage of population with at least college, under 1 year education in the United States with a correlation coefficient (R) of -0.435 and weighted average of 60.1%. Similarly, the statistical analysis conducted on geographies consisting of 579,966,424 people shows a slight negative correlation between the proportion of English and percentage of population with at least college, under 1 year education in the United States with a correlation coefficient (R) of -0.052 and weighted average of 66.6%, a difference of 10.7%.
College, Under 1 year Correlation Summary
| Measurement | Cherokee | English |
| Minimum | 16.3% | 15.7% |
| Maximum | 81.8% | 100.0% |
| Range | 65.5% | 84.3% |
| Mean | 46.9% | 63.3% |
| Median | 47.4% | 64.9% |
| Interquartile 25% (IQ1) | 40.3% | 55.0% |
| Interquartile 75% (IQ3) | 54.4% | 71.0% |
| Interquartile Range (IQR) | 14.2% | 16.0% |
| Standard Deviation (Sample) | 11.2% | 14.9% |
| Standard Deviation (Population) | 11.2% | 14.8% |
Similar Demographics by College, Under 1 year
Demographics Similar to Cherokee by College, Under 1 year
In terms of college, under 1 year, the demographic groups most similar to Cherokee are Belizean (60.1%, a difference of 0.040%), Crow (60.2%, a difference of 0.11%), Ute (60.2%, a difference of 0.20%), Yaqui (60.2%, a difference of 0.21%), and Bahamian (60.3%, a difference of 0.25%).
| Demographics | Rating | Rank | College, Under 1 year |
| Alaska Natives | 0.1 /100 | #274 | Tragic 60.4% |
| Immigrants | Barbados | 0.1 /100 | #275 | Tragic 60.4% |
| Arapaho | 0.1 /100 | #276 | Tragic 60.3% |
| Bahamians | 0.1 /100 | #277 | Tragic 60.3% |
| Yaqui | 0.1 /100 | #278 | Tragic 60.2% |
| Ute | 0.1 /100 | #279 | Tragic 60.2% |
| Crow | 0.1 /100 | #280 | Tragic 60.2% |
| Cherokee | 0.1 /100 | #281 | Tragic 60.1% |
| Belizeans | 0.1 /100 | #282 | Tragic 60.1% |
| Immigrants | Jamaica | 0.0 /100 | #283 | Tragic 59.7% |
| Immigrants | St. Vincent and the Grenadines | 0.0 /100 | #284 | Tragic 59.6% |
| Paiute | 0.0 /100 | #285 | Tragic 59.6% |
| British West Indians | 0.0 /100 | #286 | Tragic 59.5% |
| Sioux | 0.0 /100 | #287 | Tragic 59.4% |
| Blacks/African Americans | 0.0 /100 | #288 | Tragic 59.4% |
Demographics Similar to English by College, Under 1 year
In terms of college, under 1 year, the demographic groups most similar to English are Immigrants from Uganda (66.5%, a difference of 0.010%), Immigrants from Germany (66.5%, a difference of 0.070%), Immigrants from Kenya (66.5%, a difference of 0.090%), Kenyan (66.5%, a difference of 0.090%), and Immigrants from Morocco (66.5%, a difference of 0.090%).
| Demographics | Rating | Rank | College, Under 1 year |
| Canadians | 87.9 /100 | #135 | Excellent 66.8% |
| Ugandans | 87.8 /100 | #136 | Excellent 66.8% |
| Immigrants | Chile | 87.4 /100 | #137 | Excellent 66.8% |
| Immigrants | Italy | 86.9 /100 | #138 | Excellent 66.8% |
| Venezuelans | 85.9 /100 | #139 | Excellent 66.7% |
| Slavs | 85.9 /100 | #140 | Excellent 66.7% |
| Immigrants | Afghanistan | 85.1 /100 | #141 | Excellent 66.7% |
| English | 82.9 /100 | #142 | Excellent 66.6% |
| Immigrants | Uganda | 82.8 /100 | #143 | Excellent 66.5% |
| Immigrants | Germany | 82.0 /100 | #144 | Excellent 66.5% |
| Immigrants | Kenya | 81.8 /100 | #145 | Excellent 66.5% |
| Kenyans | 81.7 /100 | #146 | Excellent 66.5% |
| Immigrants | Morocco | 81.7 /100 | #147 | Excellent 66.5% |
| Taiwanese | 78.6 /100 | #148 | Good 66.4% |
| Immigrants | Venezuela | 77.9 /100 | #149 | Good 66.3% |