Uruguayan vs Immigrants from Croatia Disability
COMPARE
Uruguayan
Immigrants from Croatia
Disability
Disability Comparison
Uruguayans
Immigrants from Croatia
11.2%
DISABILITY
97.4/ 100
METRIC RATING
98th/ 347
METRIC RANK
11.4%
DISABILITY
89.8/ 100
METRIC RATING
131st/ 347
METRIC RANK
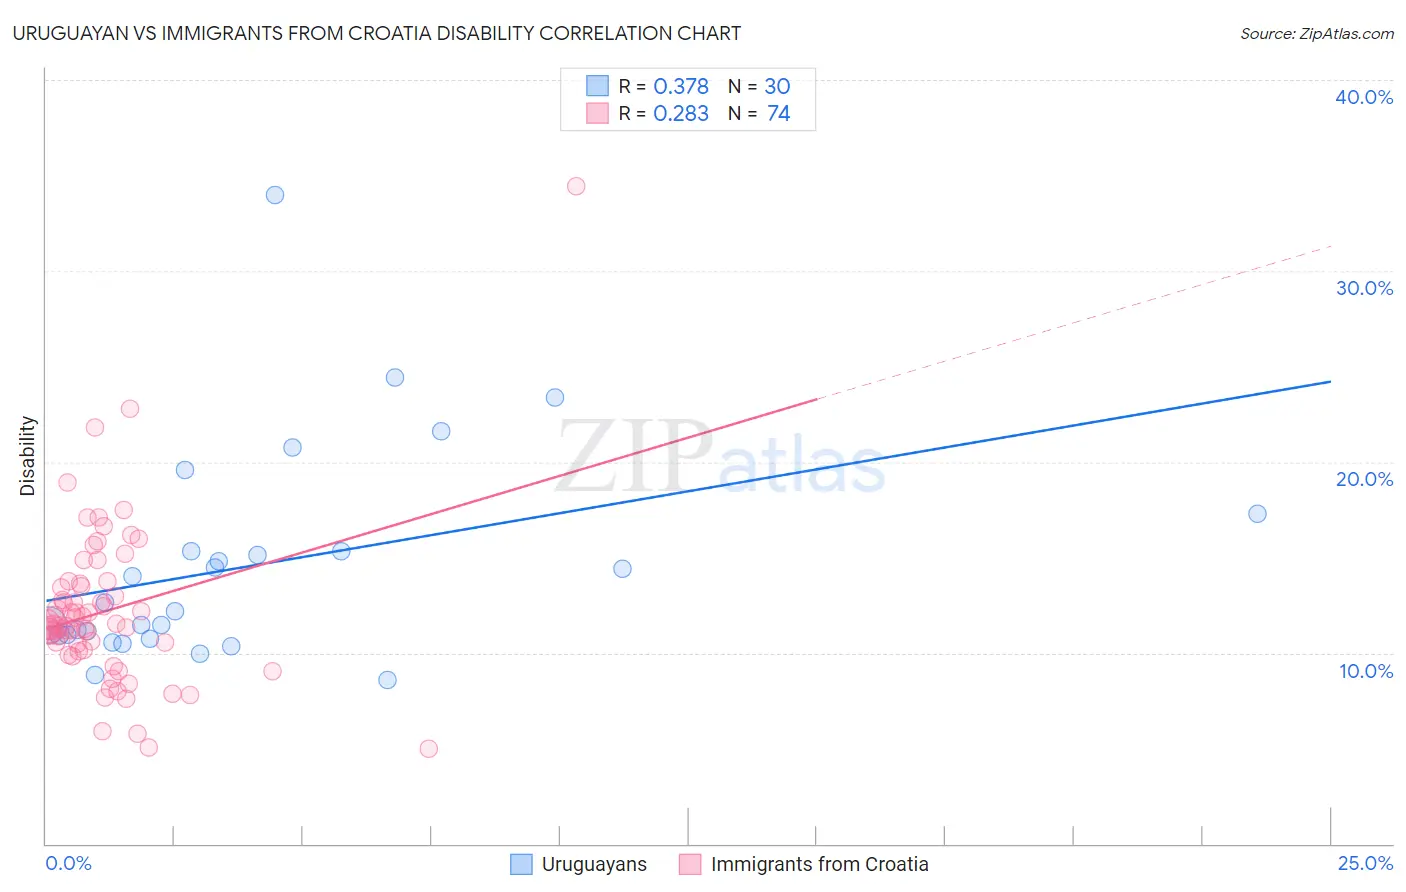
Uruguayan vs Immigrants from Croatia Disability Correlation Chart
The statistical analysis conducted on geographies consisting of 144,784,951 people shows a mild positive correlation between the proportion of Uruguayans and percentage of population with a disability in the United States with a correlation coefficient (R) of 0.378 and weighted average of 11.2%. Similarly, the statistical analysis conducted on geographies consisting of 132,571,649 people shows a weak positive correlation between the proportion of Immigrants from Croatia and percentage of population with a disability in the United States with a correlation coefficient (R) of 0.283 and weighted average of 11.4%, a difference of 1.7%.
Disability Correlation Summary
| Measurement | Uruguayan | Immigrants from Croatia |
| Minimum | 8.6% | 5.0% |
| Maximum | 34.0% | 34.4% |
| Range | 25.4% | 29.5% |
| Mean | 14.6% | 12.2% |
| Median | 12.4% | 11.5% |
| Interquartile 25% (IQ1) | 10.9% | 10.1% |
| Interquartile 75% (IQ3) | 15.3% | 13.5% |
| Interquartile Range (IQR) | 4.4% | 3.4% |
| Standard Deviation (Sample) | 5.6% | 4.3% |
| Standard Deviation (Population) | 5.5% | 4.2% |
Similar Demographics by Disability
Demographics Similar to Uruguayans by Disability
In terms of disability, the demographic groups most similar to Uruguayans are Bhutanese (11.2%, a difference of 0.0%), Immigrants from Czechoslovakia (11.2%, a difference of 0.010%), Immigrants from Zimbabwe (11.2%, a difference of 0.14%), Immigrants from Greece (11.3%, a difference of 0.18%), and Immigrants from Morocco (11.2%, a difference of 0.21%).
| Demographics | Rating | Rank | Disability |
| Immigrants | Western Asia | 98.1 /100 | #91 | Exceptional 11.2% |
| Ecuadorians | 98.0 /100 | #92 | Exceptional 11.2% |
| Immigrants | Ecuador | 98.0 /100 | #93 | Exceptional 11.2% |
| Immigrants | Morocco | 97.8 /100 | #94 | Exceptional 11.2% |
| Eastern Europeans | 97.8 /100 | #95 | Exceptional 11.2% |
| Immigrants | Zimbabwe | 97.7 /100 | #96 | Exceptional 11.2% |
| Bhutanese | 97.4 /100 | #97 | Exceptional 11.2% |
| Uruguayans | 97.4 /100 | #98 | Exceptional 11.2% |
| Immigrants | Czechoslovakia | 97.4 /100 | #99 | Exceptional 11.2% |
| Immigrants | Greece | 96.9 /100 | #100 | Exceptional 11.3% |
| Immigrants | Nicaragua | 96.8 /100 | #101 | Exceptional 11.3% |
| Immigrants | Eastern Africa | 96.7 /100 | #102 | Exceptional 11.3% |
| Immigrants | Uruguay | 96.4 /100 | #103 | Exceptional 11.3% |
| Immigrants | Immigrants | 96.4 /100 | #104 | Exceptional 11.3% |
| Immigrants | Kazakhstan | 96.4 /100 | #105 | Exceptional 11.3% |
Demographics Similar to Immigrants from Croatia by Disability
In terms of disability, the demographic groups most similar to Immigrants from Croatia are Latvian (11.4%, a difference of 0.010%), Macedonian (11.4%, a difference of 0.060%), Immigrants from Africa (11.4%, a difference of 0.060%), Immigrants from Italy (11.4%, a difference of 0.080%), and Immigrants from Europe (11.4%, a difference of 0.080%).
| Demographics | Rating | Rank | Disability |
| South American Indians | 92.2 /100 | #124 | Exceptional 11.4% |
| Costa Ricans | 91.9 /100 | #125 | Exceptional 11.4% |
| Immigrants | Latvia | 90.9 /100 | #126 | Exceptional 11.4% |
| Immigrants | Italy | 90.4 /100 | #127 | Exceptional 11.4% |
| Immigrants | Europe | 90.4 /100 | #128 | Exceptional 11.4% |
| Macedonians | 90.3 /100 | #129 | Exceptional 11.4% |
| Latvians | 89.8 /100 | #130 | Excellent 11.4% |
| Immigrants | Croatia | 89.8 /100 | #131 | Excellent 11.4% |
| Immigrants | Africa | 89.3 /100 | #132 | Excellent 11.4% |
| Arabs | 89.1 /100 | #133 | Excellent 11.4% |
| Immigrants | Guyana | 88.3 /100 | #134 | Excellent 11.4% |
| Ugandans | 87.9 /100 | #135 | Excellent 11.4% |
| Immigrants | St. Vincent and the Grenadines | 87.8 /100 | #136 | Excellent 11.4% |
| Kenyans | 87.1 /100 | #137 | Excellent 11.5% |
| New Zealanders | 87.0 /100 | #138 | Excellent 11.5% |