Tongan vs Immigrants from Zimbabwe Male Disability
COMPARE
Tongan
Immigrants from Zimbabwe
Male Disability
Male Disability Comparison
Tongans
Immigrants from Zimbabwe
10.4%
MALE DISABILITY
99.6/ 100
METRIC RATING
56th/ 347
METRIC RANK
10.8%
MALE DISABILITY
93.0/ 100
METRIC RATING
113th/ 347
METRIC RANK
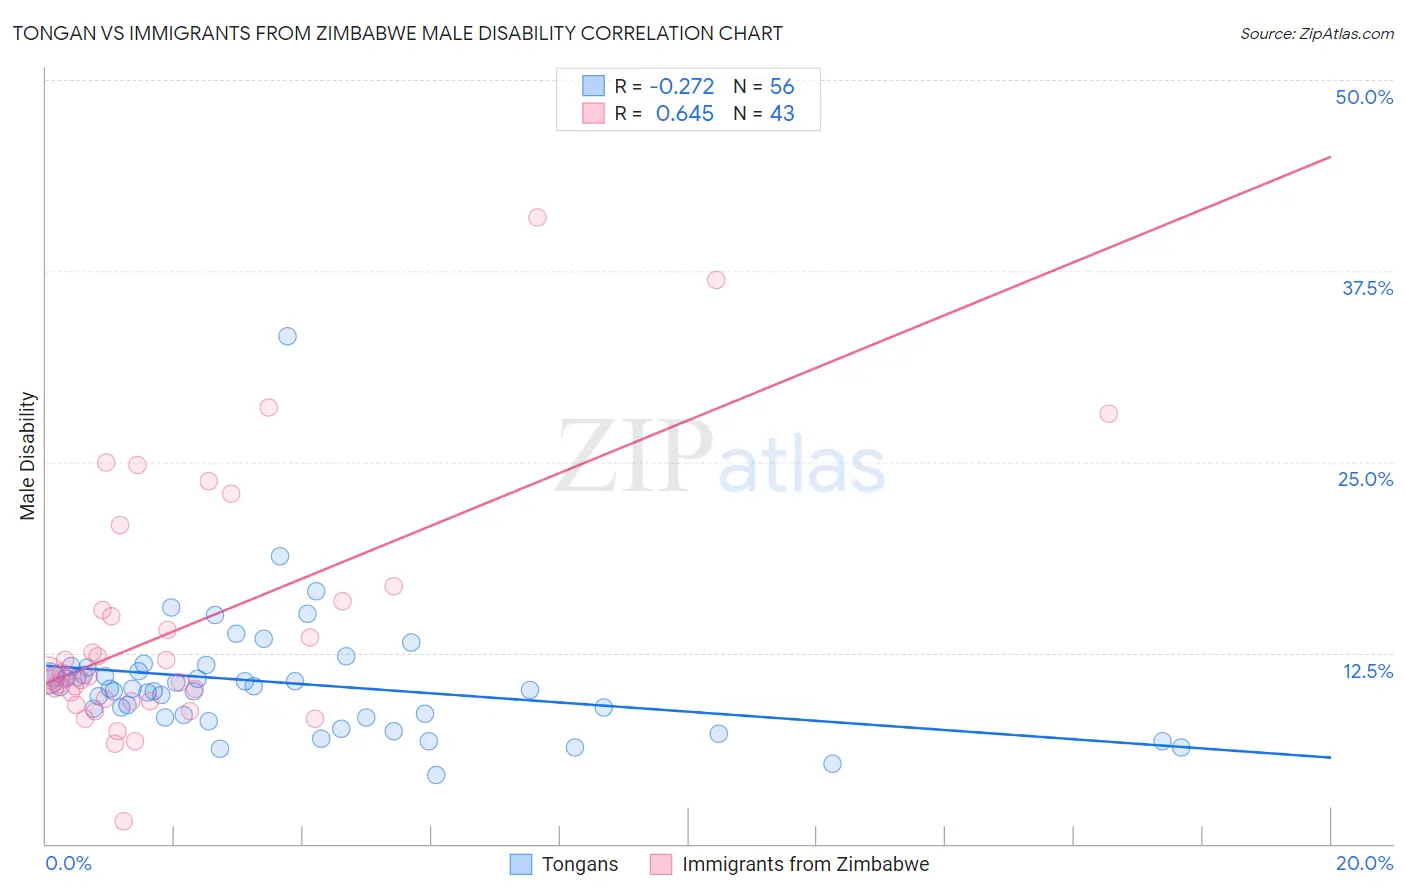
Tongan vs Immigrants from Zimbabwe Male Disability Correlation Chart
The statistical analysis conducted on geographies consisting of 102,894,634 people shows a weak negative correlation between the proportion of Tongans and percentage of males with a disability in the United States with a correlation coefficient (R) of -0.272 and weighted average of 10.4%. Similarly, the statistical analysis conducted on geographies consisting of 117,811,453 people shows a significant positive correlation between the proportion of Immigrants from Zimbabwe and percentage of males with a disability in the United States with a correlation coefficient (R) of 0.645 and weighted average of 10.8%, a difference of 4.3%.
Male Disability Correlation Summary
| Measurement | Tongan | Immigrants from Zimbabwe |
| Minimum | 4.5% | 1.5% |
| Maximum | 33.3% | 41.0% |
| Range | 28.7% | 39.5% |
| Mean | 10.6% | 14.2% |
| Median | 10.2% | 11.0% |
| Interquartile 25% (IQ1) | 8.3% | 9.4% |
| Interquartile 75% (IQ3) | 11.4% | 15.9% |
| Interquartile Range (IQR) | 3.1% | 6.5% |
| Standard Deviation (Sample) | 4.2% | 8.2% |
| Standard Deviation (Population) | 4.1% | 8.1% |
Similar Demographics by Male Disability
Demographics Similar to Tongans by Male Disability
In terms of male disability, the demographic groups most similar to Tongans are Immigrants from South America (10.4%, a difference of 0.020%), Immigrants from Eritrea (10.4%, a difference of 0.040%), Peruvian (10.4%, a difference of 0.060%), Immigrants from Uzbekistan (10.4%, a difference of 0.10%), and Immigrants from Japan (10.4%, a difference of 0.10%).
| Demographics | Rating | Rank | Male Disability |
| Immigrants | Spain | 99.7 /100 | #49 | Exceptional 10.3% |
| South Americans | 99.6 /100 | #50 | Exceptional 10.3% |
| Salvadorans | 99.6 /100 | #51 | Exceptional 10.4% |
| Immigrants | Saudi Arabia | 99.6 /100 | #52 | Exceptional 10.4% |
| Immigrants | Uzbekistan | 99.6 /100 | #53 | Exceptional 10.4% |
| Peruvians | 99.6 /100 | #54 | Exceptional 10.4% |
| Immigrants | Eritrea | 99.6 /100 | #55 | Exceptional 10.4% |
| Tongans | 99.6 /100 | #56 | Exceptional 10.4% |
| Immigrants | South America | 99.6 /100 | #57 | Exceptional 10.4% |
| Immigrants | Japan | 99.5 /100 | #58 | Exceptional 10.4% |
| Immigrants | Australia | 99.5 /100 | #59 | Exceptional 10.4% |
| Immigrants | Colombia | 99.5 /100 | #60 | Exceptional 10.4% |
| Immigrants | Northern Africa | 99.4 /100 | #61 | Exceptional 10.4% |
| Immigrants | Ecuador | 99.3 /100 | #62 | Exceptional 10.4% |
| Immigrants | Belarus | 99.3 /100 | #63 | Exceptional 10.4% |
Demographics Similar to Immigrants from Zimbabwe by Male Disability
In terms of male disability, the demographic groups most similar to Immigrants from Zimbabwe are Central American (10.8%, a difference of 0.070%), Ghanaian (10.8%, a difference of 0.090%), Immigrants from Barbados (10.8%, a difference of 0.16%), Immigrants from Uruguay (10.8%, a difference of 0.18%), and Immigrants (10.8%, a difference of 0.22%).
| Demographics | Rating | Rank | Male Disability |
| Immigrants | Syria | 94.9 /100 | #106 | Exceptional 10.8% |
| Immigrants | Eastern Africa | 94.3 /100 | #107 | Exceptional 10.8% |
| Immigrants | Belgium | 94.2 /100 | #108 | Exceptional 10.8% |
| Immigrants | Uganda | 94.0 /100 | #109 | Exceptional 10.8% |
| Immigrants | Immigrants | 93.9 /100 | #110 | Exceptional 10.8% |
| Immigrants | Uruguay | 93.8 /100 | #111 | Exceptional 10.8% |
| Ghanaians | 93.4 /100 | #112 | Exceptional 10.8% |
| Immigrants | Zimbabwe | 93.0 /100 | #113 | Exceptional 10.8% |
| Central Americans | 92.7 /100 | #114 | Exceptional 10.8% |
| Immigrants | Barbados | 92.2 /100 | #115 | Exceptional 10.8% |
| Immigrants | South Africa | 91.8 /100 | #116 | Exceptional 10.8% |
| Eastern Europeans | 90.6 /100 | #117 | Exceptional 10.9% |
| Immigrants | Cuba | 90.2 /100 | #118 | Exceptional 10.9% |
| Armenians | 90.1 /100 | #119 | Exceptional 10.9% |
| Immigrants | Africa | 89.4 /100 | #120 | Excellent 10.9% |