Tongan vs Slavic Male Disability
COMPARE
Tongan
Slavic
Male Disability
Male Disability Comparison
Tongans
Slavs
10.4%
MALE DISABILITY
99.6/ 100
METRIC RATING
56th/ 347
METRIC RANK
12.2%
MALE DISABILITY
0.2/ 100
METRIC RATING
261st/ 347
METRIC RANK
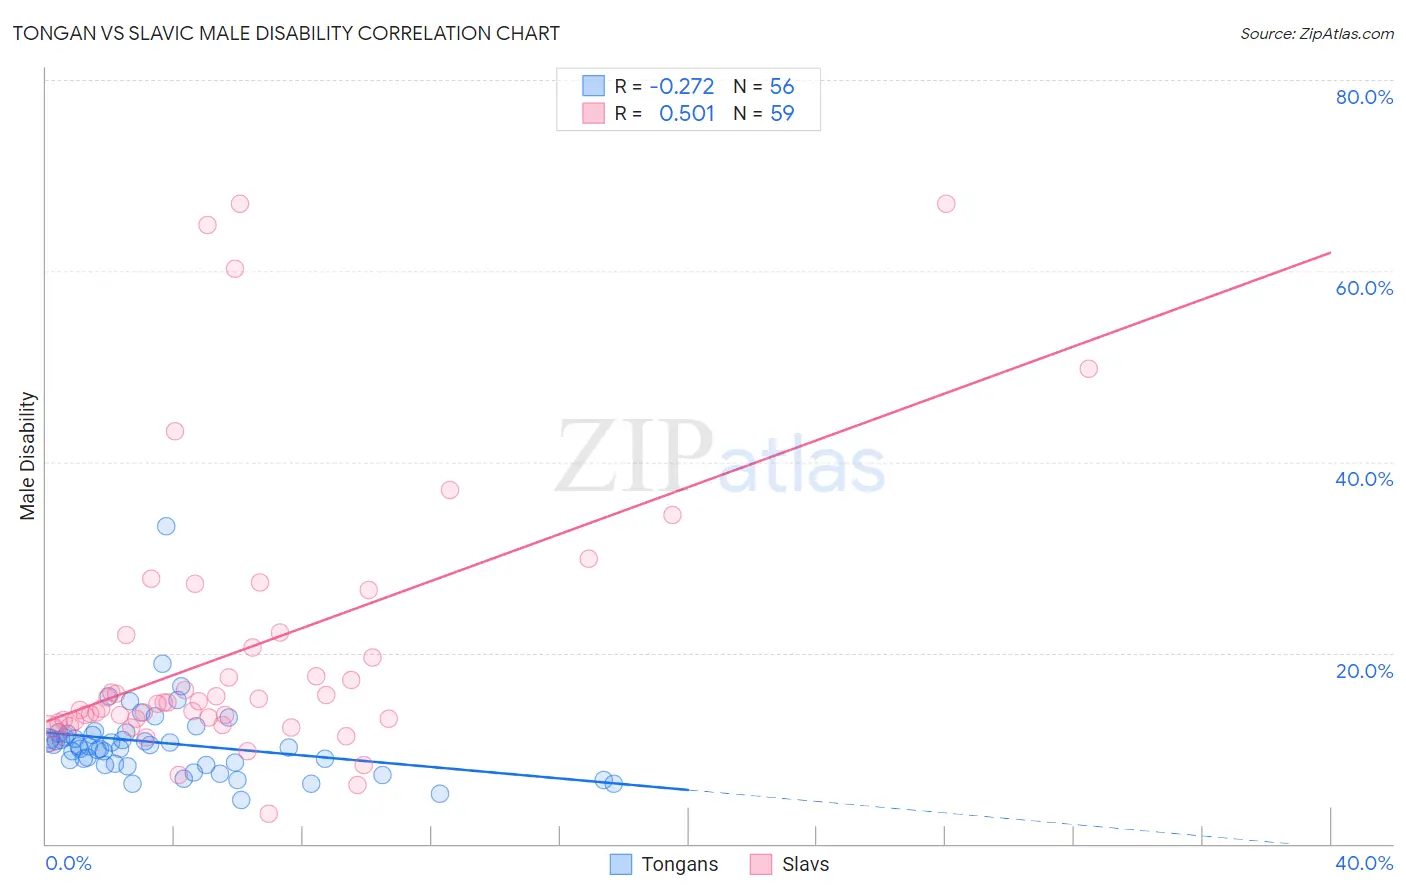
Tongan vs Slavic Male Disability Correlation Chart
The statistical analysis conducted on geographies consisting of 102,894,634 people shows a weak negative correlation between the proportion of Tongans and percentage of males with a disability in the United States with a correlation coefficient (R) of -0.272 and weighted average of 10.4%. Similarly, the statistical analysis conducted on geographies consisting of 270,856,634 people shows a substantial positive correlation between the proportion of Slavs and percentage of males with a disability in the United States with a correlation coefficient (R) of 0.501 and weighted average of 12.2%, a difference of 17.4%.
Male Disability Correlation Summary
| Measurement | Tongan | Slavic |
| Minimum | 4.5% | 3.2% |
| Maximum | 33.3% | 67.0% |
| Range | 28.7% | 63.9% |
| Mean | 10.6% | 20.3% |
| Median | 10.2% | 14.8% |
| Interquartile 25% (IQ1) | 8.3% | 12.8% |
| Interquartile 75% (IQ3) | 11.4% | 21.9% |
| Interquartile Range (IQR) | 3.1% | 9.1% |
| Standard Deviation (Sample) | 4.2% | 14.7% |
| Standard Deviation (Population) | 4.1% | 14.6% |
Similar Demographics by Male Disability
Demographics Similar to Tongans by Male Disability
In terms of male disability, the demographic groups most similar to Tongans are Immigrants from South America (10.4%, a difference of 0.020%), Immigrants from Eritrea (10.4%, a difference of 0.040%), Peruvian (10.4%, a difference of 0.060%), Immigrants from Uzbekistan (10.4%, a difference of 0.10%), and Immigrants from Japan (10.4%, a difference of 0.10%).
| Demographics | Rating | Rank | Male Disability |
| Immigrants | Spain | 99.7 /100 | #49 | Exceptional 10.3% |
| South Americans | 99.6 /100 | #50 | Exceptional 10.3% |
| Salvadorans | 99.6 /100 | #51 | Exceptional 10.4% |
| Immigrants | Saudi Arabia | 99.6 /100 | #52 | Exceptional 10.4% |
| Immigrants | Uzbekistan | 99.6 /100 | #53 | Exceptional 10.4% |
| Peruvians | 99.6 /100 | #54 | Exceptional 10.4% |
| Immigrants | Eritrea | 99.6 /100 | #55 | Exceptional 10.4% |
| Tongans | 99.6 /100 | #56 | Exceptional 10.4% |
| Immigrants | South America | 99.6 /100 | #57 | Exceptional 10.4% |
| Immigrants | Japan | 99.5 /100 | #58 | Exceptional 10.4% |
| Immigrants | Australia | 99.5 /100 | #59 | Exceptional 10.4% |
| Immigrants | Colombia | 99.5 /100 | #60 | Exceptional 10.4% |
| Immigrants | Northern Africa | 99.4 /100 | #61 | Exceptional 10.4% |
| Immigrants | Ecuador | 99.3 /100 | #62 | Exceptional 10.4% |
| Immigrants | Belarus | 99.3 /100 | #63 | Exceptional 10.4% |
Demographics Similar to Slavs by Male Disability
In terms of male disability, the demographic groups most similar to Slavs are Norwegian (12.2%, a difference of 0.010%), Canadian (12.2%, a difference of 0.21%), Nepalese (12.2%, a difference of 0.25%), Swedish (12.1%, a difference of 0.36%), and Belgian (12.1%, a difference of 0.43%).
| Demographics | Rating | Rank | Male Disability |
| British | 0.4 /100 | #254 | Tragic 12.1% |
| Chinese | 0.4 /100 | #255 | Tragic 12.1% |
| Swiss | 0.3 /100 | #256 | Tragic 12.1% |
| Europeans | 0.3 /100 | #257 | Tragic 12.1% |
| Basques | 0.3 /100 | #258 | Tragic 12.1% |
| Belgians | 0.3 /100 | #259 | Tragic 12.1% |
| Swedes | 0.3 /100 | #260 | Tragic 12.1% |
| Slavs | 0.2 /100 | #261 | Tragic 12.2% |
| Norwegians | 0.2 /100 | #262 | Tragic 12.2% |
| Canadians | 0.2 /100 | #263 | Tragic 12.2% |
| Nepalese | 0.2 /100 | #264 | Tragic 12.2% |
| Immigrants | Portugal | 0.1 /100 | #265 | Tragic 12.3% |
| Hawaiians | 0.1 /100 | #266 | Tragic 12.3% |
| Immigrants | Germany | 0.1 /100 | #267 | Tragic 12.3% |
| Portuguese | 0.1 /100 | #268 | Tragic 12.3% |