Tongan vs Immigrants from Chile Male Disability
COMPARE
Tongan
Immigrants from Chile
Male Disability
Male Disability Comparison
Tongans
Immigrants from Chile
10.4%
MALE DISABILITY
99.6/ 100
METRIC RATING
56th/ 347
METRIC RANK
10.6%
MALE DISABILITY
98.3/ 100
METRIC RATING
81st/ 347
METRIC RANK
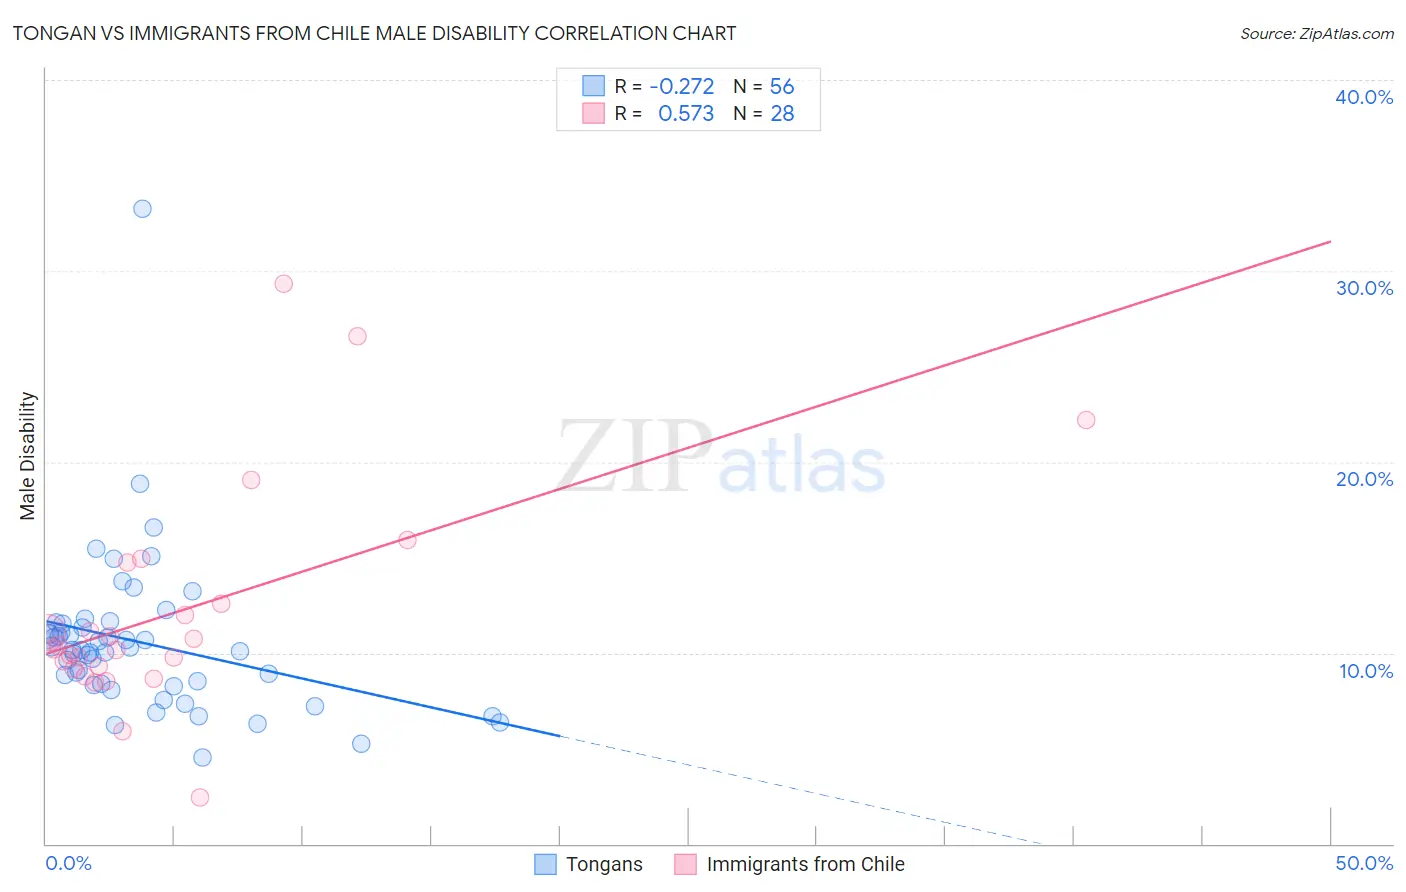
Tongan vs Immigrants from Chile Male Disability Correlation Chart
The statistical analysis conducted on geographies consisting of 102,894,634 people shows a weak negative correlation between the proportion of Tongans and percentage of males with a disability in the United States with a correlation coefficient (R) of -0.272 and weighted average of 10.4%. Similarly, the statistical analysis conducted on geographies consisting of 218,637,346 people shows a substantial positive correlation between the proportion of Immigrants from Chile and percentage of males with a disability in the United States with a correlation coefficient (R) of 0.573 and weighted average of 10.6%, a difference of 2.1%.
Male Disability Correlation Summary
| Measurement | Tongan | Immigrants from Chile |
| Minimum | 4.5% | 2.4% |
| Maximum | 33.3% | 29.3% |
| Range | 28.7% | 26.9% |
| Mean | 10.6% | 12.2% |
| Median | 10.2% | 10.3% |
| Interquartile 25% (IQ1) | 8.3% | 9.2% |
| Interquartile 75% (IQ3) | 11.4% | 13.6% |
| Interquartile Range (IQR) | 3.1% | 4.4% |
| Standard Deviation (Sample) | 4.2% | 5.8% |
| Standard Deviation (Population) | 4.1% | 5.7% |
Similar Demographics by Male Disability
Demographics Similar to Tongans by Male Disability
In terms of male disability, the demographic groups most similar to Tongans are Immigrants from South America (10.4%, a difference of 0.020%), Immigrants from Eritrea (10.4%, a difference of 0.040%), Peruvian (10.4%, a difference of 0.060%), Immigrants from Uzbekistan (10.4%, a difference of 0.10%), and Immigrants from Japan (10.4%, a difference of 0.10%).
| Demographics | Rating | Rank | Male Disability |
| Immigrants | Spain | 99.7 /100 | #49 | Exceptional 10.3% |
| South Americans | 99.6 /100 | #50 | Exceptional 10.3% |
| Salvadorans | 99.6 /100 | #51 | Exceptional 10.4% |
| Immigrants | Saudi Arabia | 99.6 /100 | #52 | Exceptional 10.4% |
| Immigrants | Uzbekistan | 99.6 /100 | #53 | Exceptional 10.4% |
| Peruvians | 99.6 /100 | #54 | Exceptional 10.4% |
| Immigrants | Eritrea | 99.6 /100 | #55 | Exceptional 10.4% |
| Tongans | 99.6 /100 | #56 | Exceptional 10.4% |
| Immigrants | South America | 99.6 /100 | #57 | Exceptional 10.4% |
| Immigrants | Japan | 99.5 /100 | #58 | Exceptional 10.4% |
| Immigrants | Australia | 99.5 /100 | #59 | Exceptional 10.4% |
| Immigrants | Colombia | 99.5 /100 | #60 | Exceptional 10.4% |
| Immigrants | Northern Africa | 99.4 /100 | #61 | Exceptional 10.4% |
| Immigrants | Ecuador | 99.3 /100 | #62 | Exceptional 10.4% |
| Immigrants | Belarus | 99.3 /100 | #63 | Exceptional 10.4% |
Demographics Similar to Immigrants from Chile by Male Disability
In terms of male disability, the demographic groups most similar to Immigrants from Chile are Immigrants from Jordan (10.6%, a difference of 0.060%), Immigrants from Guyana (10.6%, a difference of 0.070%), Zimbabwean (10.6%, a difference of 0.080%), Immigrants from Poland (10.6%, a difference of 0.13%), and Bulgarian (10.6%, a difference of 0.14%).
| Demographics | Rating | Rank | Male Disability |
| Immigrants | Lebanon | 98.8 /100 | #74 | Exceptional 10.5% |
| Sierra Leoneans | 98.7 /100 | #75 | Exceptional 10.5% |
| Immigrants | Sierra Leone | 98.7 /100 | #76 | Exceptional 10.5% |
| Laotians | 98.6 /100 | #77 | Exceptional 10.6% |
| Immigrants | Russia | 98.6 /100 | #78 | Exceptional 10.6% |
| Zimbabweans | 98.4 /100 | #79 | Exceptional 10.6% |
| Immigrants | Jordan | 98.4 /100 | #80 | Exceptional 10.6% |
| Immigrants | Chile | 98.3 /100 | #81 | Exceptional 10.6% |
| Immigrants | Guyana | 98.2 /100 | #82 | Exceptional 10.6% |
| Immigrants | Poland | 98.1 /100 | #83 | Exceptional 10.6% |
| Bulgarians | 98.1 /100 | #84 | Exceptional 10.6% |
| Sri Lankans | 97.9 /100 | #85 | Exceptional 10.6% |
| Immigrants | Ireland | 97.9 /100 | #86 | Exceptional 10.6% |
| Immigrants | Vietnam | 97.9 /100 | #87 | Exceptional 10.6% |
| Immigrants | Western Asia | 97.8 /100 | #88 | Exceptional 10.6% |