Tongan vs Arab Male Disability
COMPARE
Tongan
Arab
Male Disability
Male Disability Comparison
Tongans
Arabs
10.4%
MALE DISABILITY
99.6/ 100
METRIC RATING
56th/ 347
METRIC RANK
11.0%
MALE DISABILITY
81.5/ 100
METRIC RATING
141st/ 347
METRIC RANK
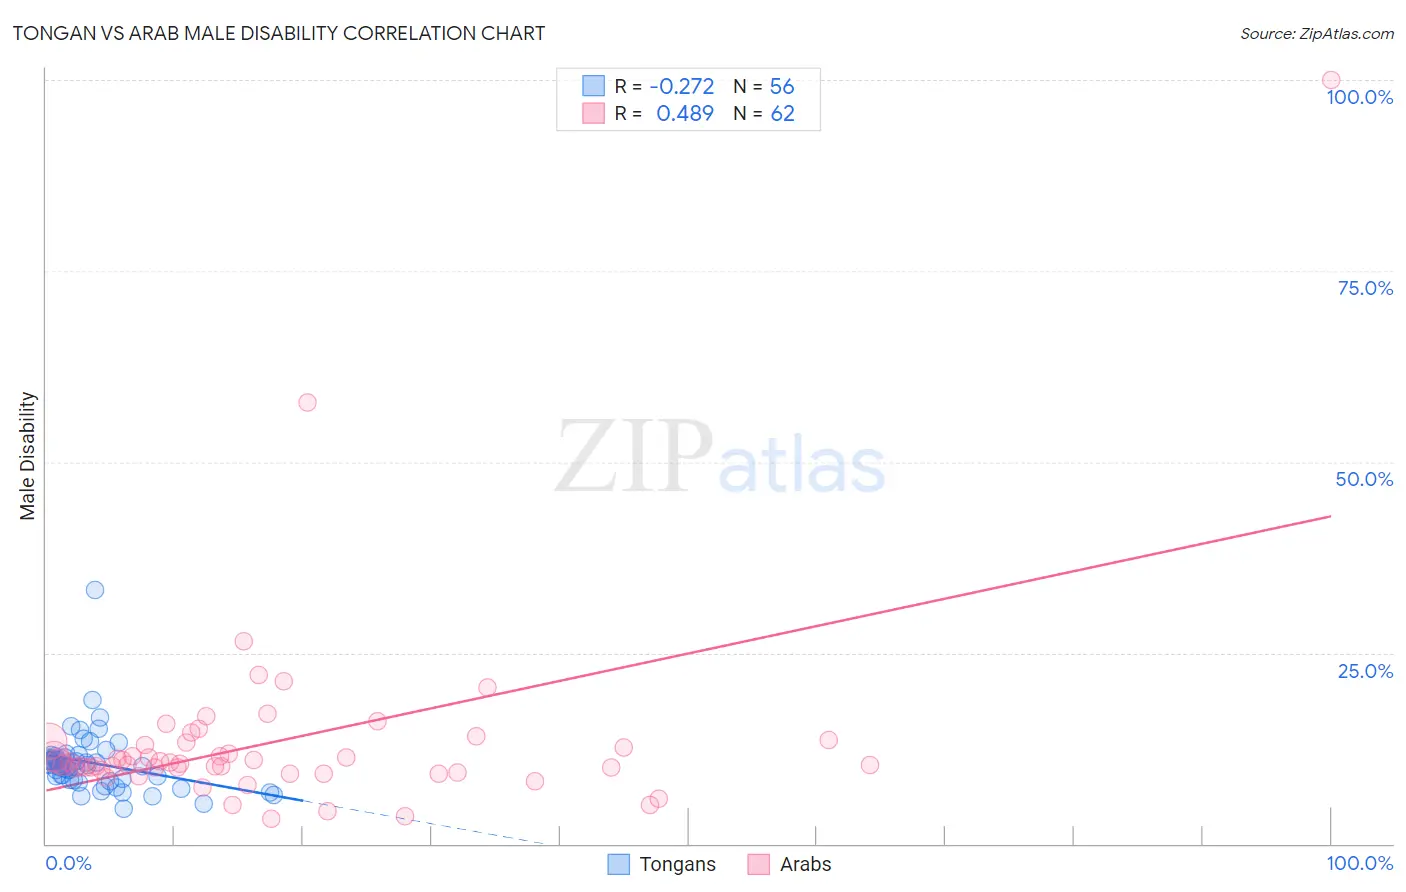
Tongan vs Arab Male Disability Correlation Chart
The statistical analysis conducted on geographies consisting of 102,894,634 people shows a weak negative correlation between the proportion of Tongans and percentage of males with a disability in the United States with a correlation coefficient (R) of -0.272 and weighted average of 10.4%. Similarly, the statistical analysis conducted on geographies consisting of 486,768,170 people shows a moderate positive correlation between the proportion of Arabs and percentage of males with a disability in the United States with a correlation coefficient (R) of 0.489 and weighted average of 11.0%, a difference of 5.9%.
Male Disability Correlation Summary
| Measurement | Tongan | Arab |
| Minimum | 4.5% | 3.3% |
| Maximum | 33.3% | 100.0% |
| Range | 28.7% | 96.7% |
| Mean | 10.6% | 13.5% |
| Median | 10.2% | 10.5% |
| Interquartile 25% (IQ1) | 8.3% | 9.6% |
| Interquartile 75% (IQ3) | 11.4% | 13.2% |
| Interquartile Range (IQR) | 3.1% | 3.6% |
| Standard Deviation (Sample) | 4.2% | 13.3% |
| Standard Deviation (Population) | 4.1% | 13.2% |
Similar Demographics by Male Disability
Demographics Similar to Tongans by Male Disability
In terms of male disability, the demographic groups most similar to Tongans are Immigrants from South America (10.4%, a difference of 0.020%), Immigrants from Eritrea (10.4%, a difference of 0.040%), Peruvian (10.4%, a difference of 0.060%), Immigrants from Uzbekistan (10.4%, a difference of 0.10%), and Immigrants from Japan (10.4%, a difference of 0.10%).
| Demographics | Rating | Rank | Male Disability |
| Immigrants | Spain | 99.7 /100 | #49 | Exceptional 10.3% |
| South Americans | 99.6 /100 | #50 | Exceptional 10.3% |
| Salvadorans | 99.6 /100 | #51 | Exceptional 10.4% |
| Immigrants | Saudi Arabia | 99.6 /100 | #52 | Exceptional 10.4% |
| Immigrants | Uzbekistan | 99.6 /100 | #53 | Exceptional 10.4% |
| Peruvians | 99.6 /100 | #54 | Exceptional 10.4% |
| Immigrants | Eritrea | 99.6 /100 | #55 | Exceptional 10.4% |
| Tongans | 99.6 /100 | #56 | Exceptional 10.4% |
| Immigrants | South America | 99.6 /100 | #57 | Exceptional 10.4% |
| Immigrants | Japan | 99.5 /100 | #58 | Exceptional 10.4% |
| Immigrants | Australia | 99.5 /100 | #59 | Exceptional 10.4% |
| Immigrants | Colombia | 99.5 /100 | #60 | Exceptional 10.4% |
| Immigrants | Northern Africa | 99.4 /100 | #61 | Exceptional 10.4% |
| Immigrants | Ecuador | 99.3 /100 | #62 | Exceptional 10.4% |
| Immigrants | Belarus | 99.3 /100 | #63 | Exceptional 10.4% |
Demographics Similar to Arabs by Male Disability
In terms of male disability, the demographic groups most similar to Arabs are Immigrants from Italy (11.0%, a difference of 0.0%), Immigrants from Sudan (11.0%, a difference of 0.0%), South African (11.0%, a difference of 0.020%), Nigerian (11.0%, a difference of 0.040%), and Immigrants from Europe (11.0%, a difference of 0.050%).
| Demographics | Rating | Rank | Male Disability |
| Bhutanese | 83.4 /100 | #134 | Excellent 11.0% |
| Trinidadians and Tobagonians | 83.3 /100 | #135 | Excellent 11.0% |
| Immigrants | Costa Rica | 82.8 /100 | #136 | Excellent 11.0% |
| Immigrants | Europe | 82.0 /100 | #137 | Excellent 11.0% |
| Nigerians | 81.9 /100 | #138 | Excellent 11.0% |
| South Africans | 81.7 /100 | #139 | Excellent 11.0% |
| Immigrants | Italy | 81.5 /100 | #140 | Excellent 11.0% |
| Arabs | 81.5 /100 | #141 | Excellent 11.0% |
| Immigrants | Sudan | 81.5 /100 | #142 | Excellent 11.0% |
| Moroccans | 80.7 /100 | #143 | Excellent 11.0% |
| Kenyans | 78.1 /100 | #144 | Good 11.0% |
| Costa Ricans | 78.0 /100 | #145 | Good 11.0% |
| Koreans | 77.5 /100 | #146 | Good 11.0% |
| Immigrants | Croatia | 77.3 /100 | #147 | Good 11.0% |
| Sudanese | 77.1 /100 | #148 | Good 11.0% |