Tongan vs Immigrants from Nepal Male Disability
COMPARE
Tongan
Immigrants from Nepal
Male Disability
Male Disability Comparison
Tongans
Immigrants from Nepal
10.4%
MALE DISABILITY
99.6/ 100
METRIC RATING
56th/ 347
METRIC RANK
10.3%
MALE DISABILITY
99.8/ 100
METRIC RATING
40th/ 347
METRIC RANK
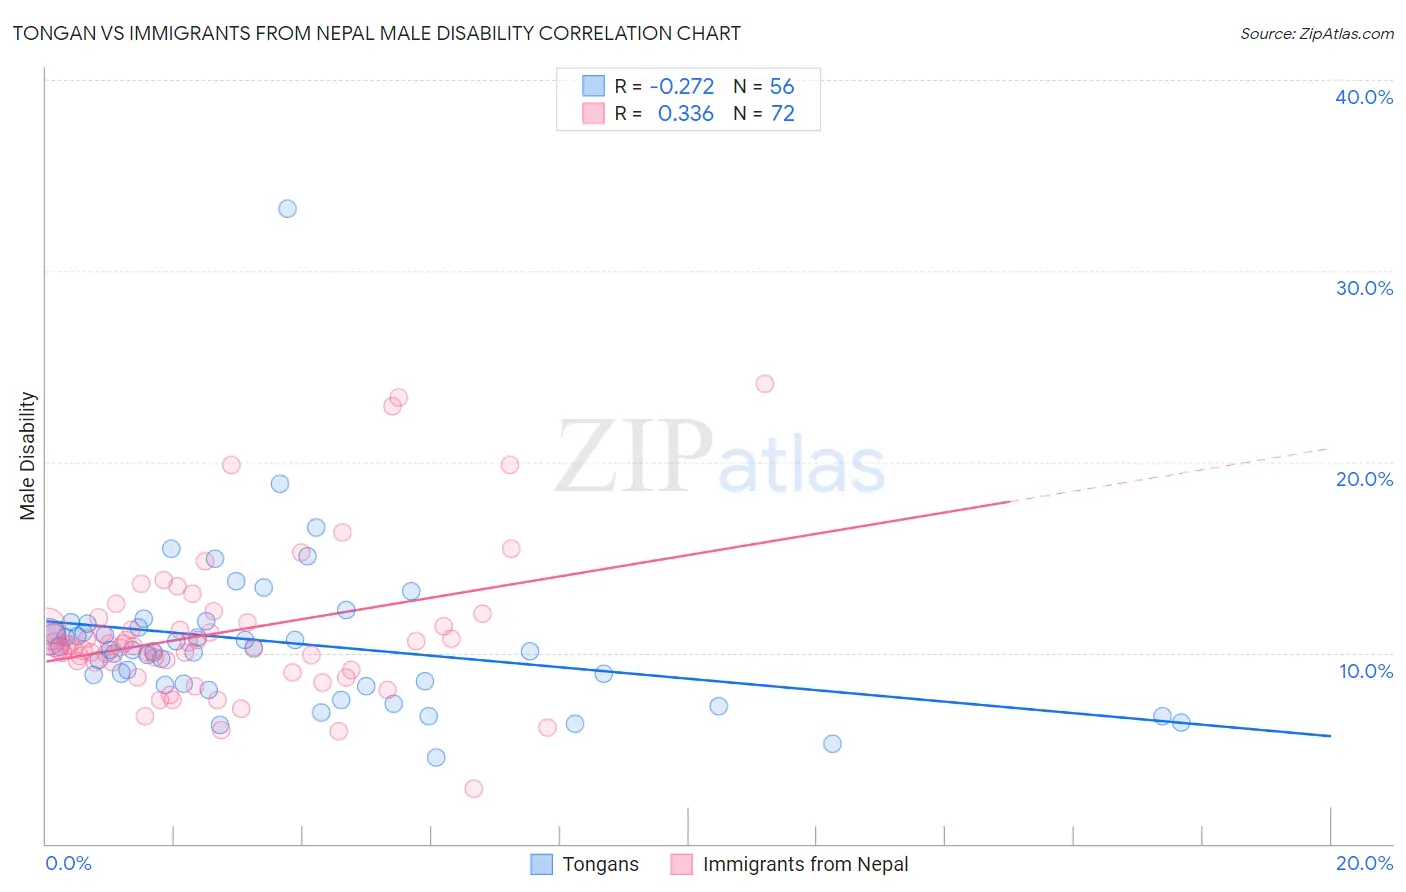
Tongan vs Immigrants from Nepal Male Disability Correlation Chart
The statistical analysis conducted on geographies consisting of 102,894,634 people shows a weak negative correlation between the proportion of Tongans and percentage of males with a disability in the United States with a correlation coefficient (R) of -0.272 and weighted average of 10.4%. Similarly, the statistical analysis conducted on geographies consisting of 186,783,252 people shows a mild positive correlation between the proportion of Immigrants from Nepal and percentage of males with a disability in the United States with a correlation coefficient (R) of 0.336 and weighted average of 10.3%, a difference of 1.0%.
Male Disability Correlation Summary
| Measurement | Tongan | Immigrants from Nepal |
| Minimum | 4.5% | 2.9% |
| Maximum | 33.3% | 24.1% |
| Range | 28.7% | 21.2% |
| Mean | 10.6% | 11.0% |
| Median | 10.2% | 10.4% |
| Interquartile 25% (IQ1) | 8.3% | 9.5% |
| Interquartile 75% (IQ3) | 11.4% | 11.5% |
| Interquartile Range (IQR) | 3.1% | 2.0% |
| Standard Deviation (Sample) | 4.2% | 3.8% |
| Standard Deviation (Population) | 4.1% | 3.8% |
Demographics Similar to Tongans and Immigrants from Nepal by Male Disability
In terms of male disability, the demographic groups most similar to Tongans are Immigrants from South America (10.4%, a difference of 0.020%), Immigrants from Eritrea (10.4%, a difference of 0.040%), Peruvian (10.4%, a difference of 0.060%), Immigrants from Uzbekistan (10.4%, a difference of 0.10%), and Immigrants from Japan (10.4%, a difference of 0.10%). Similarly, the demographic groups most similar to Immigrants from Nepal are Taiwanese (10.3%, a difference of 0.0%), Afghan (10.2%, a difference of 0.19%), Mongolian (10.3%, a difference of 0.25%), Immigrants from Bangladesh (10.3%, a difference of 0.27%), and Immigrants from Kuwait (10.2%, a difference of 0.35%).
| Demographics | Rating | Rank | Male Disability |
| Immigrants | Kuwait | 99.8 /100 | #38 | Exceptional 10.2% |
| Afghans | 99.8 /100 | #39 | Exceptional 10.2% |
| Immigrants | Nepal | 99.8 /100 | #40 | Exceptional 10.3% |
| Taiwanese | 99.8 /100 | #41 | Exceptional 10.3% |
| Mongolians | 99.7 /100 | #42 | Exceptional 10.3% |
| Immigrants | Bangladesh | 99.7 /100 | #43 | Exceptional 10.3% |
| Immigrants | El Salvador | 99.7 /100 | #44 | Exceptional 10.3% |
| Turks | 99.7 /100 | #45 | Exceptional 10.3% |
| Cambodians | 99.7 /100 | #46 | Exceptional 10.3% |
| Immigrants | Peru | 99.7 /100 | #47 | Exceptional 10.3% |
| Israelis | 99.7 /100 | #48 | Exceptional 10.3% |
| Immigrants | Spain | 99.7 /100 | #49 | Exceptional 10.3% |
| South Americans | 99.6 /100 | #50 | Exceptional 10.3% |
| Salvadorans | 99.6 /100 | #51 | Exceptional 10.4% |
| Immigrants | Saudi Arabia | 99.6 /100 | #52 | Exceptional 10.4% |
| Immigrants | Uzbekistan | 99.6 /100 | #53 | Exceptional 10.4% |
| Peruvians | 99.6 /100 | #54 | Exceptional 10.4% |
| Immigrants | Eritrea | 99.6 /100 | #55 | Exceptional 10.4% |
| Tongans | 99.6 /100 | #56 | Exceptional 10.4% |
| Immigrants | South America | 99.6 /100 | #57 | Exceptional 10.4% |
| Immigrants | Japan | 99.5 /100 | #58 | Exceptional 10.4% |