Slovak vs Cree Disability
COMPARE
Slovak
Cree
Disability
Disability Comparison
Slovaks
Cree
13.0%
DISABILITY
0.0/ 100
METRIC RATING
289th/ 347
METRIC RANK
13.7%
DISABILITY
0.0/ 100
METRIC RATING
313th/ 347
METRIC RANK
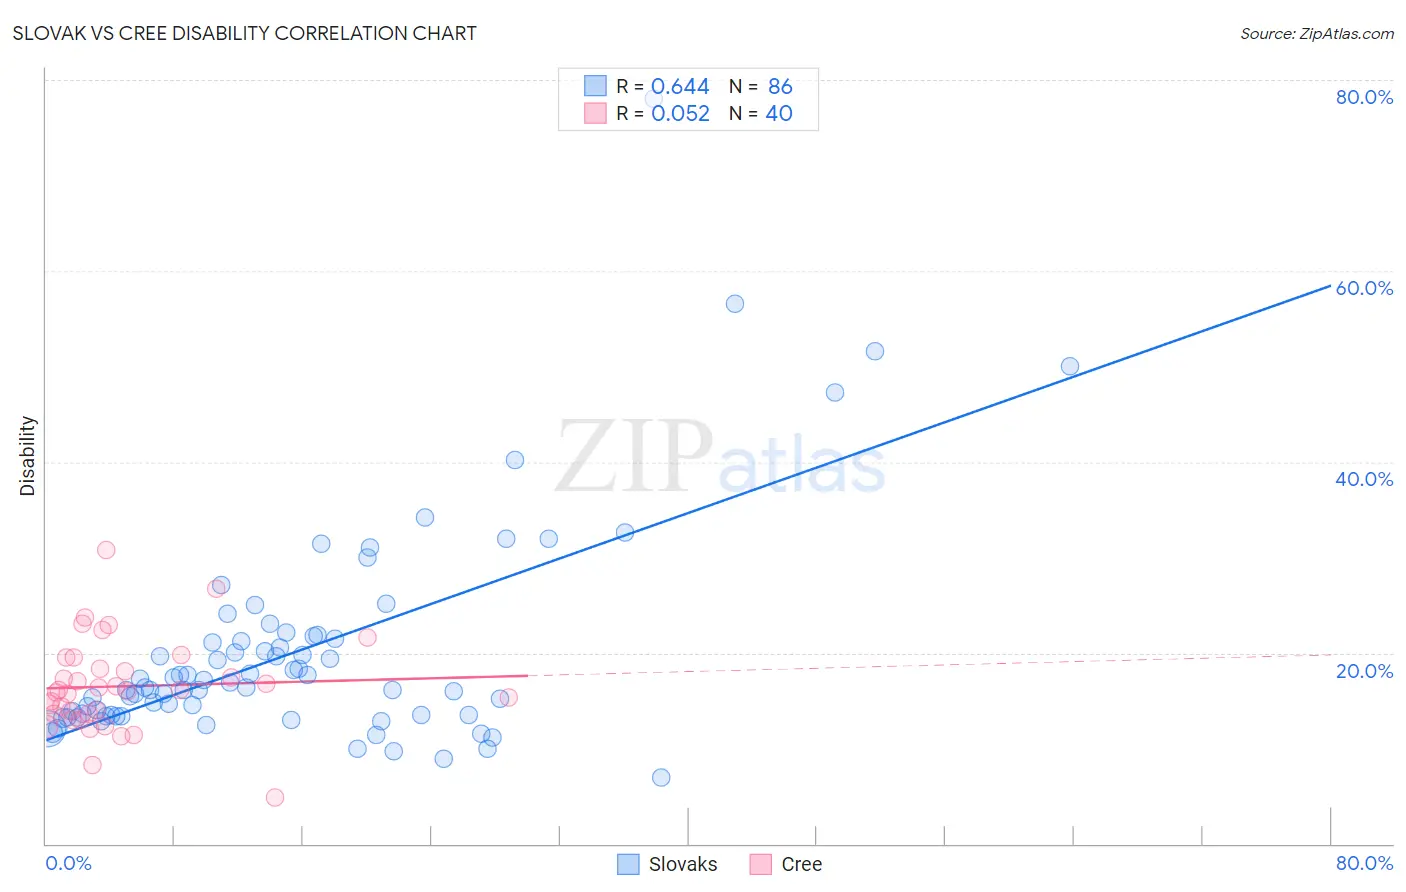
Slovak vs Cree Disability Correlation Chart
The statistical analysis conducted on geographies consisting of 397,863,317 people shows a significant positive correlation between the proportion of Slovaks and percentage of population with a disability in the United States with a correlation coefficient (R) of 0.644 and weighted average of 13.0%. Similarly, the statistical analysis conducted on geographies consisting of 76,208,800 people shows a slight positive correlation between the proportion of Cree and percentage of population with a disability in the United States with a correlation coefficient (R) of 0.052 and weighted average of 13.7%, a difference of 5.2%.
Disability Correlation Summary
| Measurement | Slovak | Cree |
| Minimum | 6.9% | 4.8% |
| Maximum | 78.0% | 30.7% |
| Range | 71.1% | 25.9% |
| Mean | 20.1% | 16.5% |
| Median | 16.4% | 16.1% |
| Interquartile 25% (IQ1) | 13.5% | 13.6% |
| Interquartile 75% (IQ3) | 21.4% | 18.9% |
| Interquartile Range (IQR) | 7.9% | 5.3% |
| Standard Deviation (Sample) | 11.4% | 4.9% |
| Standard Deviation (Population) | 11.3% | 4.8% |
Similar Demographics by Disability
Demographics Similar to Slovaks by Disability
In terms of disability, the demographic groups most similar to Slovaks are White/Caucasian (13.0%, a difference of 0.0%), African (13.0%, a difference of 0.020%), Cheyenne (13.0%, a difference of 0.060%), Yaqui (13.1%, a difference of 0.28%), and English (13.0%, a difference of 0.44%).
| Demographics | Rating | Rank | Disability |
| Scottish | 0.0 /100 | #282 | Tragic 12.9% |
| Irish | 0.0 /100 | #283 | Tragic 12.9% |
| Welsh | 0.0 /100 | #284 | Tragic 12.9% |
| Crow | 0.0 /100 | #285 | Tragic 12.9% |
| English | 0.0 /100 | #286 | Tragic 13.0% |
| Africans | 0.0 /100 | #287 | Tragic 13.0% |
| Whites/Caucasians | 0.0 /100 | #288 | Tragic 13.0% |
| Slovaks | 0.0 /100 | #289 | Tragic 13.0% |
| Cheyenne | 0.0 /100 | #290 | Tragic 13.0% |
| Yaqui | 0.0 /100 | #291 | Tragic 13.1% |
| Aleuts | 0.0 /100 | #292 | Tragic 13.1% |
| Marshallese | 0.0 /100 | #293 | Tragic 13.1% |
| Celtics | 0.0 /100 | #294 | Tragic 13.1% |
| Immigrants | Nonimmigrants | 0.0 /100 | #295 | Tragic 13.2% |
| Central American Indians | 0.0 /100 | #296 | Tragic 13.2% |
Demographics Similar to Cree by Disability
In terms of disability, the demographic groups most similar to Cree are Black/African American (13.7%, a difference of 0.040%), Puget Sound Salish (13.7%, a difference of 0.040%), Pima (13.7%, a difference of 0.070%), Immigrants from Cabo Verde (13.7%, a difference of 0.070%), and Spanish American (13.6%, a difference of 0.35%).
| Demographics | Rating | Rank | Disability |
| Cape Verdeans | 0.0 /100 | #306 | Tragic 13.5% |
| Shoshone | 0.0 /100 | #307 | Tragic 13.5% |
| French American Indians | 0.0 /100 | #308 | Tragic 13.5% |
| Tlingit-Haida | 0.0 /100 | #309 | Tragic 13.5% |
| Blackfeet | 0.0 /100 | #310 | Tragic 13.6% |
| Delaware | 0.0 /100 | #311 | Tragic 13.6% |
| Spanish Americans | 0.0 /100 | #312 | Tragic 13.6% |
| Cree | 0.0 /100 | #313 | Tragic 13.7% |
| Blacks/African Americans | 0.0 /100 | #314 | Tragic 13.7% |
| Puget Sound Salish | 0.0 /100 | #315 | Tragic 13.7% |
| Pima | 0.0 /100 | #316 | Tragic 13.7% |
| Immigrants | Cabo Verde | 0.0 /100 | #317 | Tragic 13.7% |
| Menominee | 0.0 /100 | #318 | Tragic 13.8% |
| Iroquois | 0.0 /100 | #319 | Tragic 13.8% |
| Apache | 0.0 /100 | #320 | Tragic 13.9% |