Scotch-Irish vs Immigrants from Ethiopia Disability Age Over 75
COMPARE
Scotch-Irish
Immigrants from Ethiopia
Disability Age Over 75
Disability Age Over 75 Comparison
Scotch-Irish
Immigrants from Ethiopia
47.3%
DISABILITY AGE OVER 75
52.5/ 100
METRIC RATING
172nd/ 347
METRIC RANK
46.8%
DISABILITY AGE OVER 75
89.1/ 100
METRIC RATING
134th/ 347
METRIC RANK
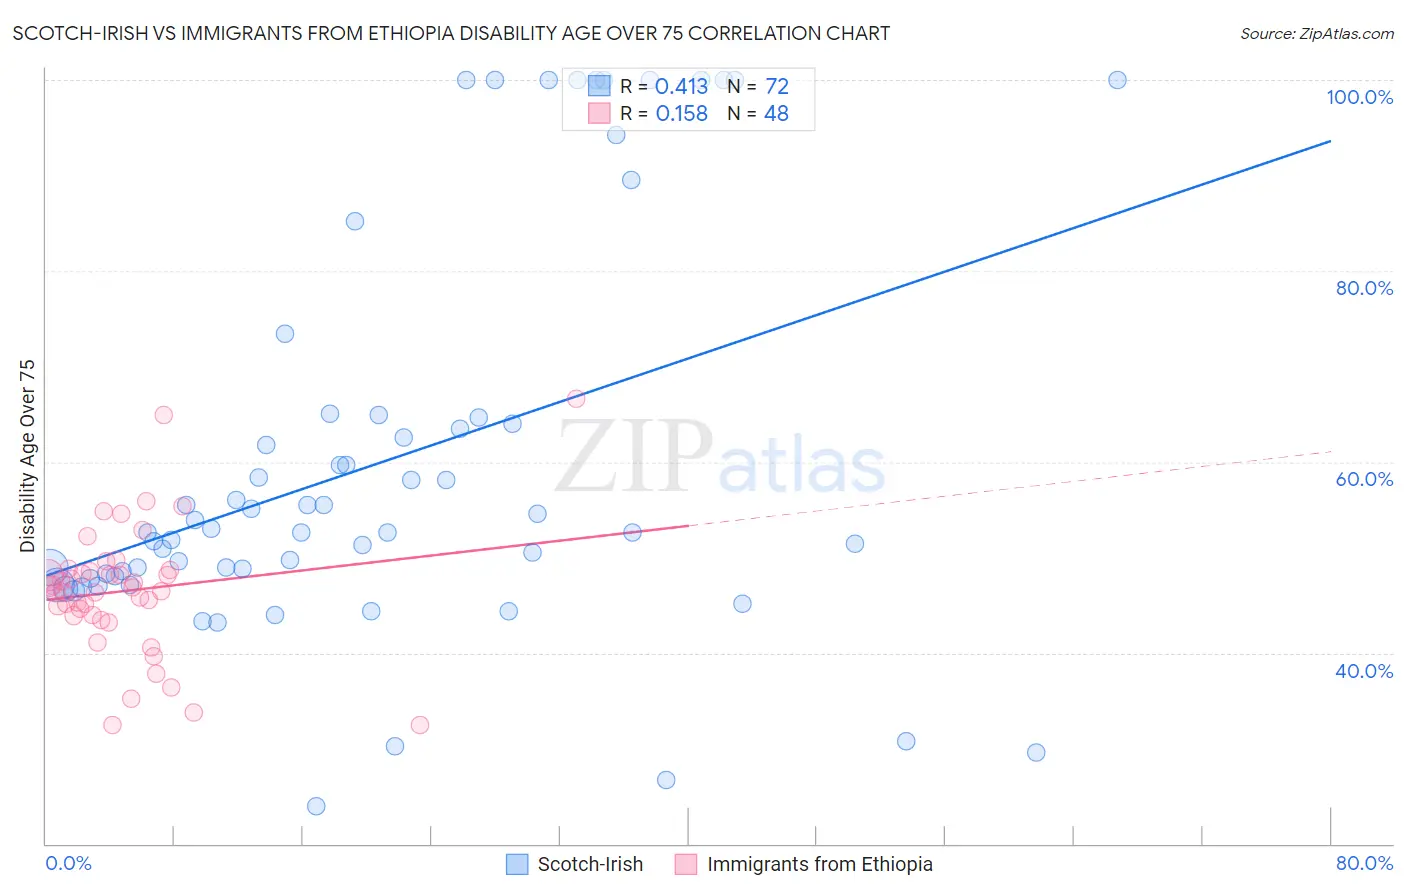
Scotch-Irish vs Immigrants from Ethiopia Disability Age Over 75 Correlation Chart
The statistical analysis conducted on geographies consisting of 547,171,445 people shows a moderate positive correlation between the proportion of Scotch-Irish and percentage of population with a disability over the age of 75 in the United States with a correlation coefficient (R) of 0.413 and weighted average of 47.3%. Similarly, the statistical analysis conducted on geographies consisting of 211,333,041 people shows a poor positive correlation between the proportion of Immigrants from Ethiopia and percentage of population with a disability over the age of 75 in the United States with a correlation coefficient (R) of 0.158 and weighted average of 46.8%, a difference of 1.1%.
Disability Age Over 75 Correlation Summary
| Measurement | Scotch-Irish | Immigrants from Ethiopia |
| Minimum | 24.0% | 32.4% |
| Maximum | 100.0% | 66.7% |
| Range | 76.0% | 34.3% |
| Mean | 59.9% | 46.5% |
| Median | 52.7% | 46.7% |
| Interquartile 25% (IQ1) | 47.9% | 43.9% |
| Interquartile 75% (IQ3) | 64.4% | 48.6% |
| Interquartile Range (IQR) | 16.4% | 4.7% |
| Standard Deviation (Sample) | 20.7% | 6.8% |
| Standard Deviation (Population) | 20.5% | 6.8% |
Similar Demographics by Disability Age Over 75
Demographics Similar to Scotch-Irish by Disability Age Over 75
In terms of disability age over 75, the demographic groups most similar to Scotch-Irish are Alsatian (47.3%, a difference of 0.010%), Immigrants from Africa (47.3%, a difference of 0.030%), White/Caucasian (47.3%, a difference of 0.060%), Immigrants from Haiti (47.3%, a difference of 0.060%), and German Russian (47.3%, a difference of 0.080%).
| Demographics | Rating | Rank | Disability Age Over 75 |
| Immigrants | Zimbabwe | 64.4 /100 | #165 | Good 47.2% |
| Immigrants | Sierra Leone | 64.4 /100 | #166 | Good 47.2% |
| Moroccans | 62.9 /100 | #167 | Good 47.2% |
| Kenyans | 58.8 /100 | #168 | Average 47.2% |
| Celtics | 58.7 /100 | #169 | Average 47.2% |
| German Russians | 56.2 /100 | #170 | Average 47.3% |
| Immigrants | Africa | 53.6 /100 | #171 | Average 47.3% |
| Scotch-Irish | 52.5 /100 | #172 | Average 47.3% |
| Alsatians | 51.9 /100 | #173 | Average 47.3% |
| Whites/Caucasians | 50.0 /100 | #174 | Average 47.3% |
| Immigrants | Haiti | 49.7 /100 | #175 | Average 47.3% |
| Ecuadorians | 46.7 /100 | #176 | Average 47.4% |
| Haitians | 44.6 /100 | #177 | Average 47.4% |
| Cubans | 42.1 /100 | #178 | Average 47.4% |
| Sierra Leoneans | 41.7 /100 | #179 | Average 47.4% |
Demographics Similar to Immigrants from Ethiopia by Disability Age Over 75
In terms of disability age over 75, the demographic groups most similar to Immigrants from Ethiopia are Ethiopian (46.8%, a difference of 0.010%), English (46.8%, a difference of 0.020%), Immigrants from Venezuela (46.8%, a difference of 0.030%), Immigrants from Uganda (46.8%, a difference of 0.030%), and Immigrants from Bosnia and Herzegovina (46.8%, a difference of 0.040%).
| Demographics | Rating | Rank | Disability Age Over 75 |
| Syrians | 91.1 /100 | #127 | Exceptional 46.7% |
| Icelanders | 90.9 /100 | #128 | Exceptional 46.7% |
| Immigrants | Germany | 90.8 /100 | #129 | Exceptional 46.7% |
| Immigrants | Northern Africa | 90.7 /100 | #130 | Exceptional 46.7% |
| Scottish | 90.5 /100 | #131 | Exceptional 46.7% |
| South Americans | 90.0 /100 | #132 | Excellent 46.8% |
| English | 89.4 /100 | #133 | Excellent 46.8% |
| Immigrants | Ethiopia | 89.1 /100 | #134 | Excellent 46.8% |
| Ethiopians | 88.9 /100 | #135 | Excellent 46.8% |
| Immigrants | Venezuela | 88.6 /100 | #136 | Excellent 46.8% |
| Immigrants | Uganda | 88.5 /100 | #137 | Excellent 46.8% |
| Immigrants | Bosnia and Herzegovina | 88.5 /100 | #138 | Excellent 46.8% |
| Yugoslavians | 88.5 /100 | #139 | Excellent 46.8% |
| Immigrants | Costa Rica | 87.4 /100 | #140 | Excellent 46.8% |
| Lebanese | 87.0 /100 | #141 | Excellent 46.8% |