Scotch-Irish vs European Disability Age Over 75
COMPARE
Scotch-Irish
European
Disability Age Over 75
Disability Age Over 75 Comparison
Scotch-Irish
Europeans
47.3%
DISABILITY AGE OVER 75
52.5/ 100
METRIC RATING
172nd/ 347
METRIC RANK
46.7%
DISABILITY AGE OVER 75
91.2/ 100
METRIC RATING
126th/ 347
METRIC RANK
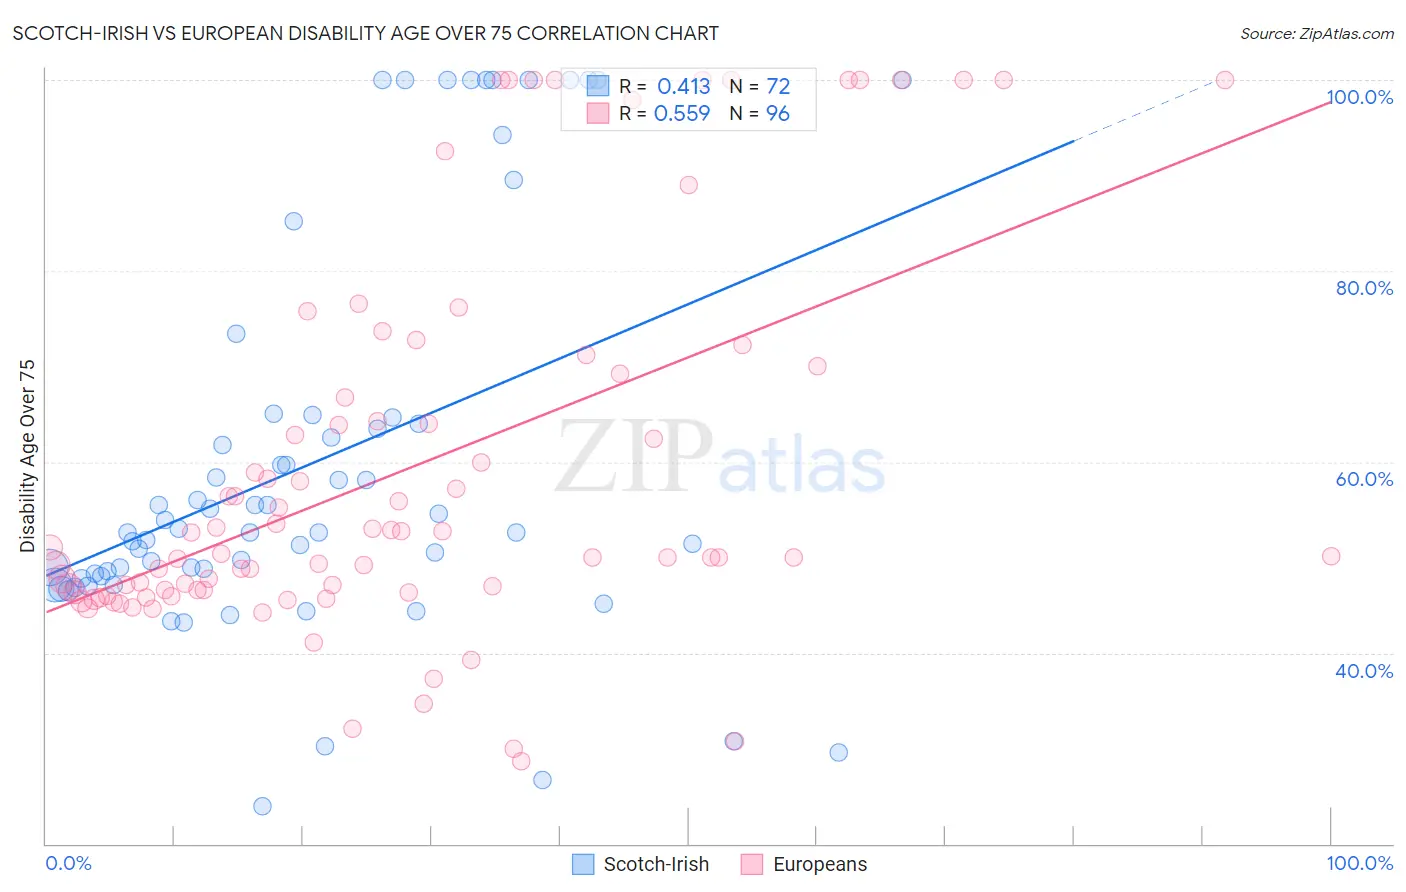
Scotch-Irish vs European Disability Age Over 75 Correlation Chart
The statistical analysis conducted on geographies consisting of 547,171,445 people shows a moderate positive correlation between the proportion of Scotch-Irish and percentage of population with a disability over the age of 75 in the United States with a correlation coefficient (R) of 0.413 and weighted average of 47.3%. Similarly, the statistical analysis conducted on geographies consisting of 559,923,693 people shows a substantial positive correlation between the proportion of Europeans and percentage of population with a disability over the age of 75 in the United States with a correlation coefficient (R) of 0.559 and weighted average of 46.7%, a difference of 1.3%.
Disability Age Over 75 Correlation Summary
| Measurement | Scotch-Irish | European |
| Minimum | 24.0% | 28.7% |
| Maximum | 100.0% | 100.0% |
| Range | 76.0% | 71.3% |
| Mean | 59.9% | 59.1% |
| Median | 52.7% | 50.2% |
| Interquartile 25% (IQ1) | 47.9% | 46.5% |
| Interquartile 75% (IQ3) | 64.4% | 68.0% |
| Interquartile Range (IQR) | 16.4% | 21.5% |
| Standard Deviation (Sample) | 20.7% | 19.7% |
| Standard Deviation (Population) | 20.5% | 19.6% |
Similar Demographics by Disability Age Over 75
Demographics Similar to Scotch-Irish by Disability Age Over 75
In terms of disability age over 75, the demographic groups most similar to Scotch-Irish are Alsatian (47.3%, a difference of 0.010%), Immigrants from Africa (47.3%, a difference of 0.030%), White/Caucasian (47.3%, a difference of 0.060%), Immigrants from Haiti (47.3%, a difference of 0.060%), and German Russian (47.3%, a difference of 0.080%).
| Demographics | Rating | Rank | Disability Age Over 75 |
| Immigrants | Zimbabwe | 64.4 /100 | #165 | Good 47.2% |
| Immigrants | Sierra Leone | 64.4 /100 | #166 | Good 47.2% |
| Moroccans | 62.9 /100 | #167 | Good 47.2% |
| Kenyans | 58.8 /100 | #168 | Average 47.2% |
| Celtics | 58.7 /100 | #169 | Average 47.2% |
| German Russians | 56.2 /100 | #170 | Average 47.3% |
| Immigrants | Africa | 53.6 /100 | #171 | Average 47.3% |
| Scotch-Irish | 52.5 /100 | #172 | Average 47.3% |
| Alsatians | 51.9 /100 | #173 | Average 47.3% |
| Whites/Caucasians | 50.0 /100 | #174 | Average 47.3% |
| Immigrants | Haiti | 49.7 /100 | #175 | Average 47.3% |
| Ecuadorians | 46.7 /100 | #176 | Average 47.4% |
| Haitians | 44.6 /100 | #177 | Average 47.4% |
| Cubans | 42.1 /100 | #178 | Average 47.4% |
| Sierra Leoneans | 41.7 /100 | #179 | Average 47.4% |
Demographics Similar to Europeans by Disability Age Over 75
In terms of disability age over 75, the demographic groups most similar to Europeans are Colombian (46.7%, a difference of 0.010%), Syrian (46.7%, a difference of 0.010%), Icelander (46.7%, a difference of 0.020%), Immigrants from Germany (46.7%, a difference of 0.030%), and Immigrants from South America (46.7%, a difference of 0.040%).
| Demographics | Rating | Rank | Disability Age Over 75 |
| Canadians | 94.4 /100 | #119 | Exceptional 46.6% |
| Immigrants | Nepal | 94.1 /100 | #120 | Exceptional 46.6% |
| Scandinavians | 93.6 /100 | #121 | Exceptional 46.6% |
| Immigrants | Albania | 93.2 /100 | #122 | Exceptional 46.6% |
| Immigrants | Colombia | 92.6 /100 | #123 | Exceptional 46.7% |
| Immigrants | South America | 91.8 /100 | #124 | Exceptional 46.7% |
| Colombians | 91.3 /100 | #125 | Exceptional 46.7% |
| Europeans | 91.2 /100 | #126 | Exceptional 46.7% |
| Syrians | 91.1 /100 | #127 | Exceptional 46.7% |
| Icelanders | 90.9 /100 | #128 | Exceptional 46.7% |
| Immigrants | Germany | 90.8 /100 | #129 | Exceptional 46.7% |
| Immigrants | Northern Africa | 90.7 /100 | #130 | Exceptional 46.7% |
| Scottish | 90.5 /100 | #131 | Exceptional 46.7% |
| South Americans | 90.0 /100 | #132 | Excellent 46.8% |
| English | 89.4 /100 | #133 | Excellent 46.8% |