Scotch-Irish vs Spaniard Disability Age Over 75
COMPARE
Scotch-Irish
Spaniard
Disability Age Over 75
Disability Age Over 75 Comparison
Scotch-Irish
Spaniards
47.3%
DISABILITY AGE OVER 75
52.5/ 100
METRIC RATING
172nd/ 347
METRIC RANK
48.1%
DISABILITY AGE OVER 75
5.7/ 100
METRIC RATING
229th/ 347
METRIC RANK
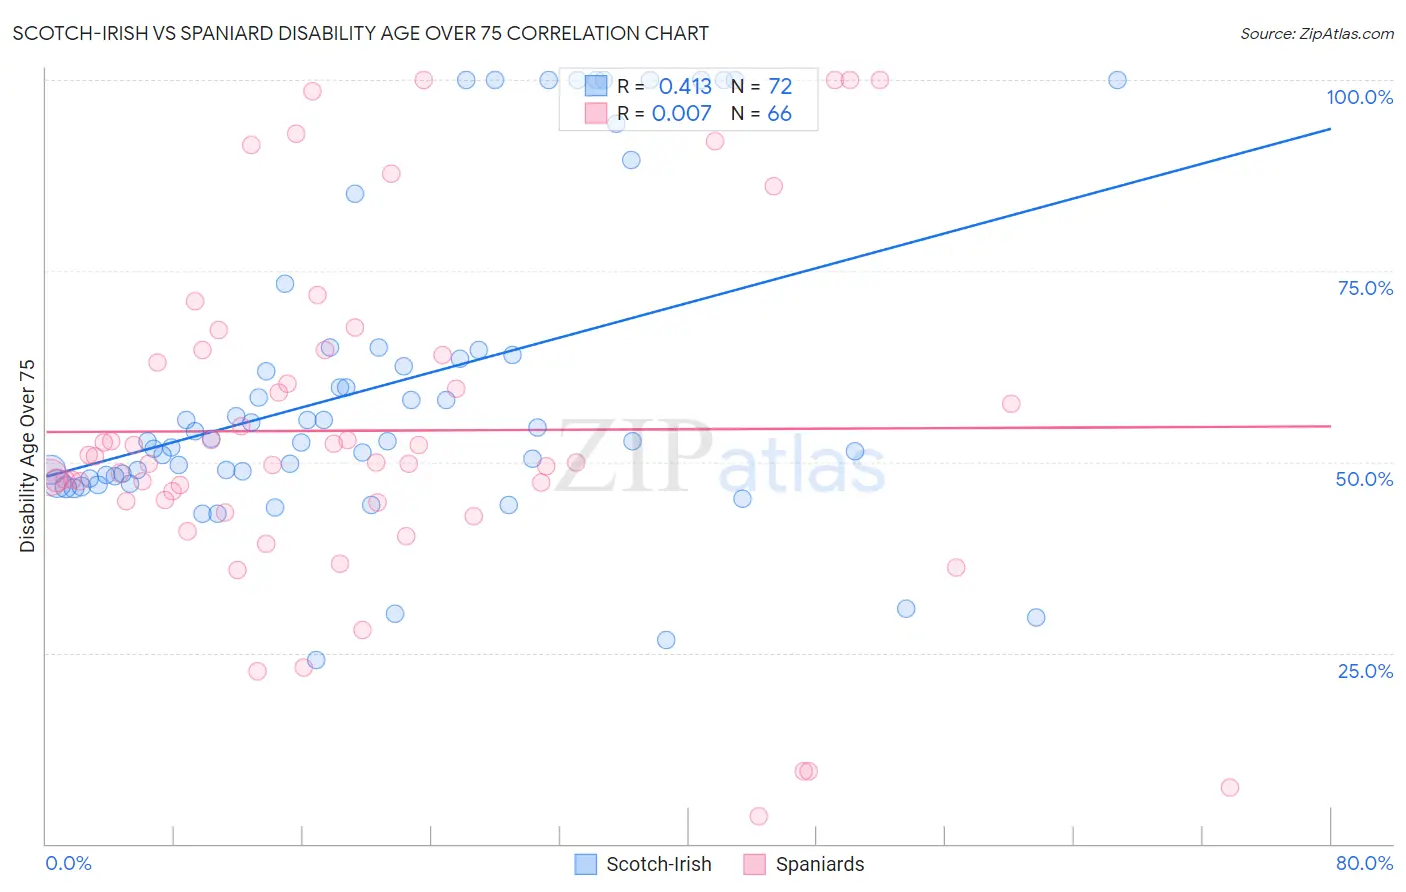
Scotch-Irish vs Spaniard Disability Age Over 75 Correlation Chart
The statistical analysis conducted on geographies consisting of 547,171,445 people shows a moderate positive correlation between the proportion of Scotch-Irish and percentage of population with a disability over the age of 75 in the United States with a correlation coefficient (R) of 0.413 and weighted average of 47.3%. Similarly, the statistical analysis conducted on geographies consisting of 442,367,902 people shows no correlation between the proportion of Spaniards and percentage of population with a disability over the age of 75 in the United States with a correlation coefficient (R) of 0.007 and weighted average of 48.1%, a difference of 1.6%.
Disability Age Over 75 Correlation Summary
| Measurement | Scotch-Irish | Spaniard |
| Minimum | 24.0% | 3.6% |
| Maximum | 100.0% | 100.0% |
| Range | 76.0% | 96.4% |
| Mean | 59.9% | 54.1% |
| Median | 52.7% | 50.0% |
| Interquartile 25% (IQ1) | 47.9% | 44.8% |
| Interquartile 75% (IQ3) | 64.4% | 64.0% |
| Interquartile Range (IQR) | 16.4% | 19.1% |
| Standard Deviation (Sample) | 20.7% | 22.3% |
| Standard Deviation (Population) | 20.5% | 22.1% |
Similar Demographics by Disability Age Over 75
Demographics Similar to Scotch-Irish by Disability Age Over 75
In terms of disability age over 75, the demographic groups most similar to Scotch-Irish are Alsatian (47.3%, a difference of 0.010%), Immigrants from Africa (47.3%, a difference of 0.030%), White/Caucasian (47.3%, a difference of 0.060%), Immigrants from Haiti (47.3%, a difference of 0.060%), and German Russian (47.3%, a difference of 0.080%).
| Demographics | Rating | Rank | Disability Age Over 75 |
| Immigrants | Zimbabwe | 64.4 /100 | #165 | Good 47.2% |
| Immigrants | Sierra Leone | 64.4 /100 | #166 | Good 47.2% |
| Moroccans | 62.9 /100 | #167 | Good 47.2% |
| Kenyans | 58.8 /100 | #168 | Average 47.2% |
| Celtics | 58.7 /100 | #169 | Average 47.2% |
| German Russians | 56.2 /100 | #170 | Average 47.3% |
| Immigrants | Africa | 53.6 /100 | #171 | Average 47.3% |
| Scotch-Irish | 52.5 /100 | #172 | Average 47.3% |
| Alsatians | 51.9 /100 | #173 | Average 47.3% |
| Whites/Caucasians | 50.0 /100 | #174 | Average 47.3% |
| Immigrants | Haiti | 49.7 /100 | #175 | Average 47.3% |
| Ecuadorians | 46.7 /100 | #176 | Average 47.4% |
| Haitians | 44.6 /100 | #177 | Average 47.4% |
| Cubans | 42.1 /100 | #178 | Average 47.4% |
| Sierra Leoneans | 41.7 /100 | #179 | Average 47.4% |
Demographics Similar to Spaniards by Disability Age Over 75
In terms of disability age over 75, the demographic groups most similar to Spaniards are Immigrants from Liberia (48.1%, a difference of 0.020%), Nonimmigrants (48.0%, a difference of 0.070%), Zimbabwean (48.1%, a difference of 0.070%), Spanish (48.0%, a difference of 0.080%), and Liberian (48.0%, a difference of 0.090%).
| Demographics | Rating | Rank | Disability Age Over 75 |
| Barbadians | 6.8 /100 | #222 | Tragic 48.0% |
| Immigrants | Bangladesh | 6.8 /100 | #223 | Tragic 48.0% |
| Liberians | 6.7 /100 | #224 | Tragic 48.0% |
| Spanish | 6.5 /100 | #225 | Tragic 48.0% |
| Immigrants | Nonimmigrants | 6.5 /100 | #226 | Tragic 48.0% |
| Zimbabweans | 6.4 /100 | #227 | Tragic 48.1% |
| Immigrants | Liberia | 5.9 /100 | #228 | Tragic 48.1% |
| Spaniards | 5.7 /100 | #229 | Tragic 48.1% |
| Taiwanese | 4.4 /100 | #230 | Tragic 48.2% |
| Immigrants | Immigrants | 4.3 /100 | #231 | Tragic 48.2% |
| Indonesians | 4.2 /100 | #232 | Tragic 48.2% |
| Cree | 4.2 /100 | #233 | Tragic 48.2% |
| Sub-Saharan Africans | 3.8 /100 | #234 | Tragic 48.2% |
| Hmong | 3.8 /100 | #235 | Tragic 48.2% |
| Immigrants | Nicaragua | 3.2 /100 | #236 | Tragic 48.2% |