Scotch-Irish vs Guatemalan Disability Age Over 75
COMPARE
Scotch-Irish
Guatemalan
Disability Age Over 75
Disability Age Over 75 Comparison
Scotch-Irish
Guatemalans
47.3%
DISABILITY AGE OVER 75
52.5/ 100
METRIC RATING
172nd/ 347
METRIC RANK
49.0%
DISABILITY AGE OVER 75
0.2/ 100
METRIC RATING
268th/ 347
METRIC RANK
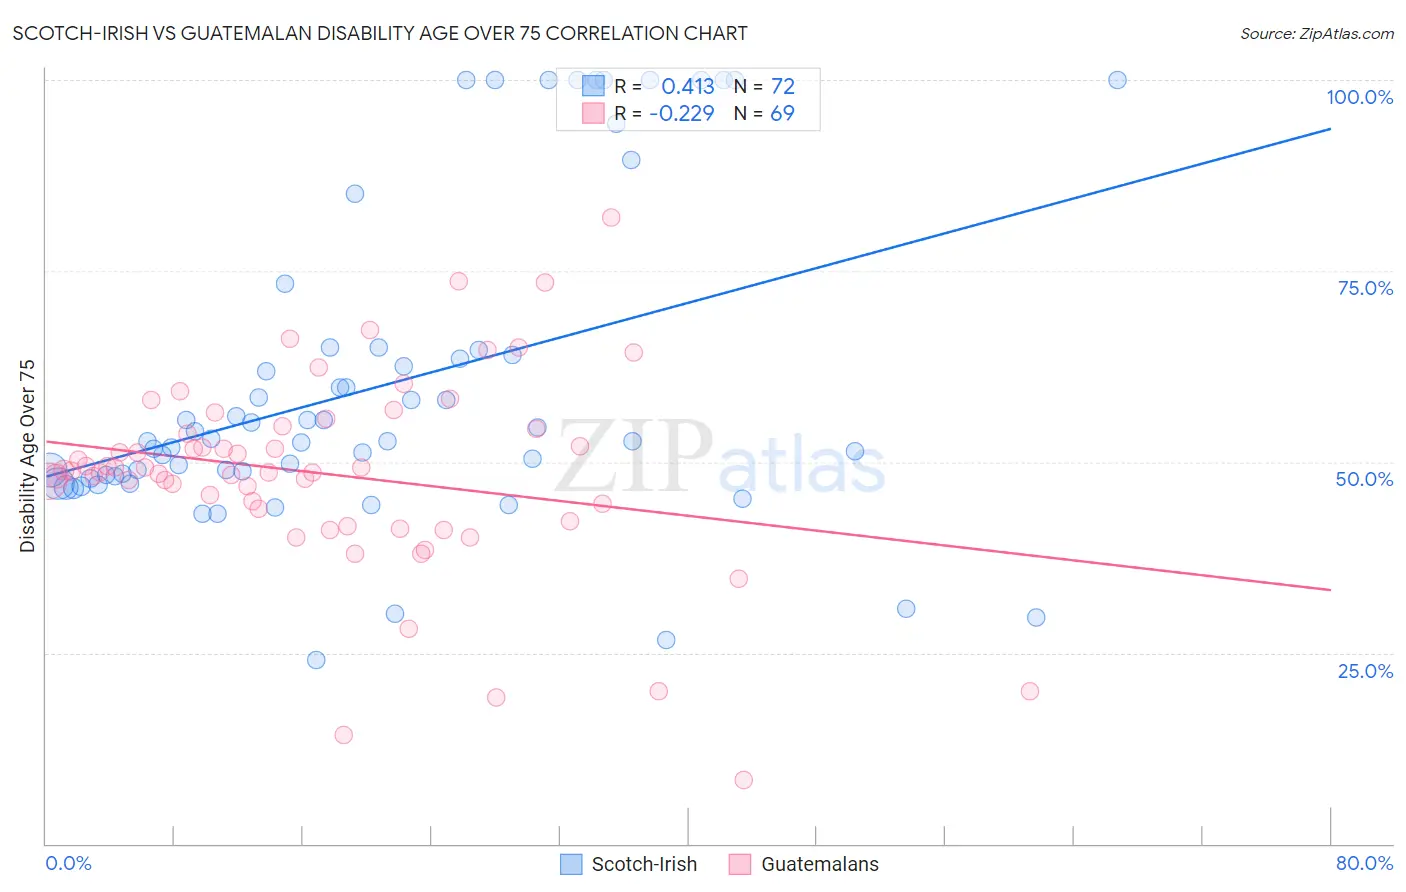
Scotch-Irish vs Guatemalan Disability Age Over 75 Correlation Chart
The statistical analysis conducted on geographies consisting of 547,171,445 people shows a moderate positive correlation between the proportion of Scotch-Irish and percentage of population with a disability over the age of 75 in the United States with a correlation coefficient (R) of 0.413 and weighted average of 47.3%. Similarly, the statistical analysis conducted on geographies consisting of 408,753,753 people shows a weak negative correlation between the proportion of Guatemalans and percentage of population with a disability over the age of 75 in the United States with a correlation coefficient (R) of -0.229 and weighted average of 49.0%, a difference of 3.6%.
Disability Age Over 75 Correlation Summary
| Measurement | Scotch-Irish | Guatemalan |
| Minimum | 24.0% | 8.3% |
| Maximum | 100.0% | 82.1% |
| Range | 76.0% | 73.7% |
| Mean | 59.9% | 48.4% |
| Median | 52.7% | 48.8% |
| Interquartile 25% (IQ1) | 47.9% | 43.1% |
| Interquartile 75% (IQ3) | 64.4% | 54.5% |
| Interquartile Range (IQR) | 16.4% | 11.5% |
| Standard Deviation (Sample) | 20.7% | 13.0% |
| Standard Deviation (Population) | 20.5% | 12.9% |
Similar Demographics by Disability Age Over 75
Demographics Similar to Scotch-Irish by Disability Age Over 75
In terms of disability age over 75, the demographic groups most similar to Scotch-Irish are Alsatian (47.3%, a difference of 0.010%), Immigrants from Africa (47.3%, a difference of 0.030%), White/Caucasian (47.3%, a difference of 0.060%), Immigrants from Haiti (47.3%, a difference of 0.060%), and German Russian (47.3%, a difference of 0.080%).
| Demographics | Rating | Rank | Disability Age Over 75 |
| Immigrants | Zimbabwe | 64.4 /100 | #165 | Good 47.2% |
| Immigrants | Sierra Leone | 64.4 /100 | #166 | Good 47.2% |
| Moroccans | 62.9 /100 | #167 | Good 47.2% |
| Kenyans | 58.8 /100 | #168 | Average 47.2% |
| Celtics | 58.7 /100 | #169 | Average 47.2% |
| German Russians | 56.2 /100 | #170 | Average 47.3% |
| Immigrants | Africa | 53.6 /100 | #171 | Average 47.3% |
| Scotch-Irish | 52.5 /100 | #172 | Average 47.3% |
| Alsatians | 51.9 /100 | #173 | Average 47.3% |
| Whites/Caucasians | 50.0 /100 | #174 | Average 47.3% |
| Immigrants | Haiti | 49.7 /100 | #175 | Average 47.3% |
| Ecuadorians | 46.7 /100 | #176 | Average 47.4% |
| Haitians | 44.6 /100 | #177 | Average 47.4% |
| Cubans | 42.1 /100 | #178 | Average 47.4% |
| Sierra Leoneans | 41.7 /100 | #179 | Average 47.4% |
Demographics Similar to Guatemalans by Disability Age Over 75
In terms of disability age over 75, the demographic groups most similar to Guatemalans are Malaysian (49.0%, a difference of 0.020%), Immigrants from El Salvador (49.0%, a difference of 0.020%), Potawatomi (49.0%, a difference of 0.050%), Fijian (49.0%, a difference of 0.070%), and Assyrian/Chaldean/Syriac (49.1%, a difference of 0.080%).
| Demographics | Rating | Rank | Disability Age Over 75 |
| Africans | 0.3 /100 | #261 | Tragic 48.9% |
| Immigrants | West Indies | 0.3 /100 | #262 | Tragic 48.9% |
| Salvadorans | 0.3 /100 | #263 | Tragic 48.9% |
| Immigrants | Honduras | 0.3 /100 | #264 | Tragic 48.9% |
| Hondurans | 0.3 /100 | #265 | Tragic 48.9% |
| U.S. Virgin Islanders | 0.2 /100 | #266 | Tragic 48.9% |
| Malaysians | 0.2 /100 | #267 | Tragic 49.0% |
| Guatemalans | 0.2 /100 | #268 | Tragic 49.0% |
| Immigrants | El Salvador | 0.2 /100 | #269 | Tragic 49.0% |
| Potawatomi | 0.2 /100 | #270 | Tragic 49.0% |
| Fijians | 0.2 /100 | #271 | Tragic 49.0% |
| Assyrians/Chaldeans/Syriacs | 0.2 /100 | #272 | Tragic 49.1% |
| Immigrants | Iraq | 0.1 /100 | #273 | Tragic 49.1% |
| Immigrants | Guatemala | 0.1 /100 | #274 | Tragic 49.1% |
| Immigrants | Dominica | 0.1 /100 | #275 | Tragic 49.1% |