Scotch-Irish vs Tongan Disability Age Over 75
COMPARE
Scotch-Irish
Tongan
Disability Age Over 75
Disability Age Over 75 Comparison
Scotch-Irish
Tongans
47.3%
DISABILITY AGE OVER 75
52.5/ 100
METRIC RATING
172nd/ 347
METRIC RANK
48.3%
DISABILITY AGE OVER 75
2.3/ 100
METRIC RATING
240th/ 347
METRIC RANK
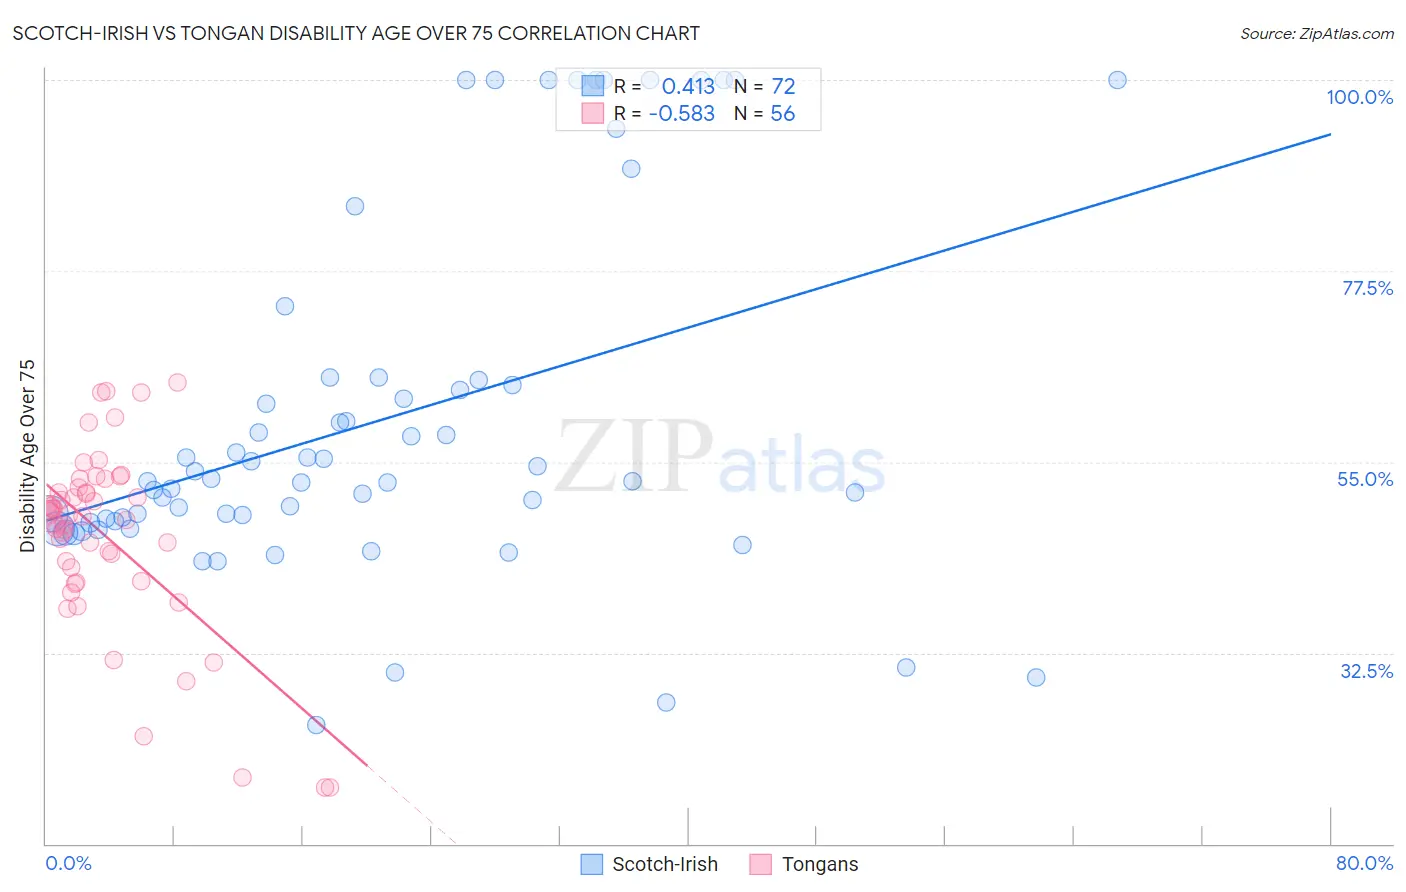
Scotch-Irish vs Tongan Disability Age Over 75 Correlation Chart
The statistical analysis conducted on geographies consisting of 547,171,445 people shows a moderate positive correlation between the proportion of Scotch-Irish and percentage of population with a disability over the age of 75 in the United States with a correlation coefficient (R) of 0.413 and weighted average of 47.3%. Similarly, the statistical analysis conducted on geographies consisting of 102,804,895 people shows a substantial negative correlation between the proportion of Tongans and percentage of population with a disability over the age of 75 in the United States with a correlation coefficient (R) of -0.583 and weighted average of 48.3%, a difference of 2.2%.
Disability Age Over 75 Correlation Summary
| Measurement | Scotch-Irish | Tongan |
| Minimum | 24.0% | 16.7% |
| Maximum | 100.0% | 64.3% |
| Range | 76.0% | 47.6% |
| Mean | 59.9% | 46.3% |
| Median | 52.7% | 48.7% |
| Interquartile 25% (IQ1) | 47.9% | 41.7% |
| Interquartile 75% (IQ3) | 64.4% | 51.6% |
| Interquartile Range (IQR) | 16.4% | 9.9% |
| Standard Deviation (Sample) | 20.7% | 10.8% |
| Standard Deviation (Population) | 20.5% | 10.7% |
Similar Demographics by Disability Age Over 75
Demographics Similar to Scotch-Irish by Disability Age Over 75
In terms of disability age over 75, the demographic groups most similar to Scotch-Irish are Alsatian (47.3%, a difference of 0.010%), Immigrants from Africa (47.3%, a difference of 0.030%), White/Caucasian (47.3%, a difference of 0.060%), Immigrants from Haiti (47.3%, a difference of 0.060%), and German Russian (47.3%, a difference of 0.080%).
| Demographics | Rating | Rank | Disability Age Over 75 |
| Immigrants | Zimbabwe | 64.4 /100 | #165 | Good 47.2% |
| Immigrants | Sierra Leone | 64.4 /100 | #166 | Good 47.2% |
| Moroccans | 62.9 /100 | #167 | Good 47.2% |
| Kenyans | 58.8 /100 | #168 | Average 47.2% |
| Celtics | 58.7 /100 | #169 | Average 47.2% |
| German Russians | 56.2 /100 | #170 | Average 47.3% |
| Immigrants | Africa | 53.6 /100 | #171 | Average 47.3% |
| Scotch-Irish | 52.5 /100 | #172 | Average 47.3% |
| Alsatians | 51.9 /100 | #173 | Average 47.3% |
| Whites/Caucasians | 50.0 /100 | #174 | Average 47.3% |
| Immigrants | Haiti | 49.7 /100 | #175 | Average 47.3% |
| Ecuadorians | 46.7 /100 | #176 | Average 47.4% |
| Haitians | 44.6 /100 | #177 | Average 47.4% |
| Cubans | 42.1 /100 | #178 | Average 47.4% |
| Sierra Leoneans | 41.7 /100 | #179 | Average 47.4% |
Demographics Similar to Tongans by Disability Age Over 75
In terms of disability age over 75, the demographic groups most similar to Tongans are Native Hawaiian (48.3%, a difference of 0.010%), French American Indian (48.3%, a difference of 0.010%), Immigrants from Caribbean (48.4%, a difference of 0.050%), Immigrants from Thailand (48.3%, a difference of 0.11%), and Afghan (48.4%, a difference of 0.14%).
| Demographics | Rating | Rank | Disability Age Over 75 |
| Cree | 4.2 /100 | #233 | Tragic 48.2% |
| Sub-Saharan Africans | 3.8 /100 | #234 | Tragic 48.2% |
| Hmong | 3.8 /100 | #235 | Tragic 48.2% |
| Immigrants | Nicaragua | 3.2 /100 | #236 | Tragic 48.2% |
| Immigrants | St. Vincent and the Grenadines | 3.2 /100 | #237 | Tragic 48.2% |
| Nicaraguans | 3.0 /100 | #238 | Tragic 48.3% |
| Immigrants | Thailand | 2.8 /100 | #239 | Tragic 48.3% |
| Tongans | 2.3 /100 | #240 | Tragic 48.3% |
| Native Hawaiians | 2.2 /100 | #241 | Tragic 48.3% |
| French American Indians | 2.2 /100 | #242 | Tragic 48.3% |
| Immigrants | Caribbean | 2.1 /100 | #243 | Tragic 48.4% |
| Afghans | 1.8 /100 | #244 | Tragic 48.4% |
| Americans | 1.7 /100 | #245 | Tragic 48.4% |
| Chippewa | 1.6 /100 | #246 | Tragic 48.4% |
| Iroquois | 1.6 /100 | #247 | Tragic 48.4% |