Scotch-Irish vs Polish Disability Age Over 75
COMPARE
Scotch-Irish
Polish
Disability Age Over 75
Disability Age Over 75 Comparison
Scotch-Irish
Poles
47.3%
DISABILITY AGE OVER 75
52.5/ 100
METRIC RATING
172nd/ 347
METRIC RANK
45.3%
DISABILITY AGE OVER 75
99.9/ 100
METRIC RATING
24th/ 347
METRIC RANK
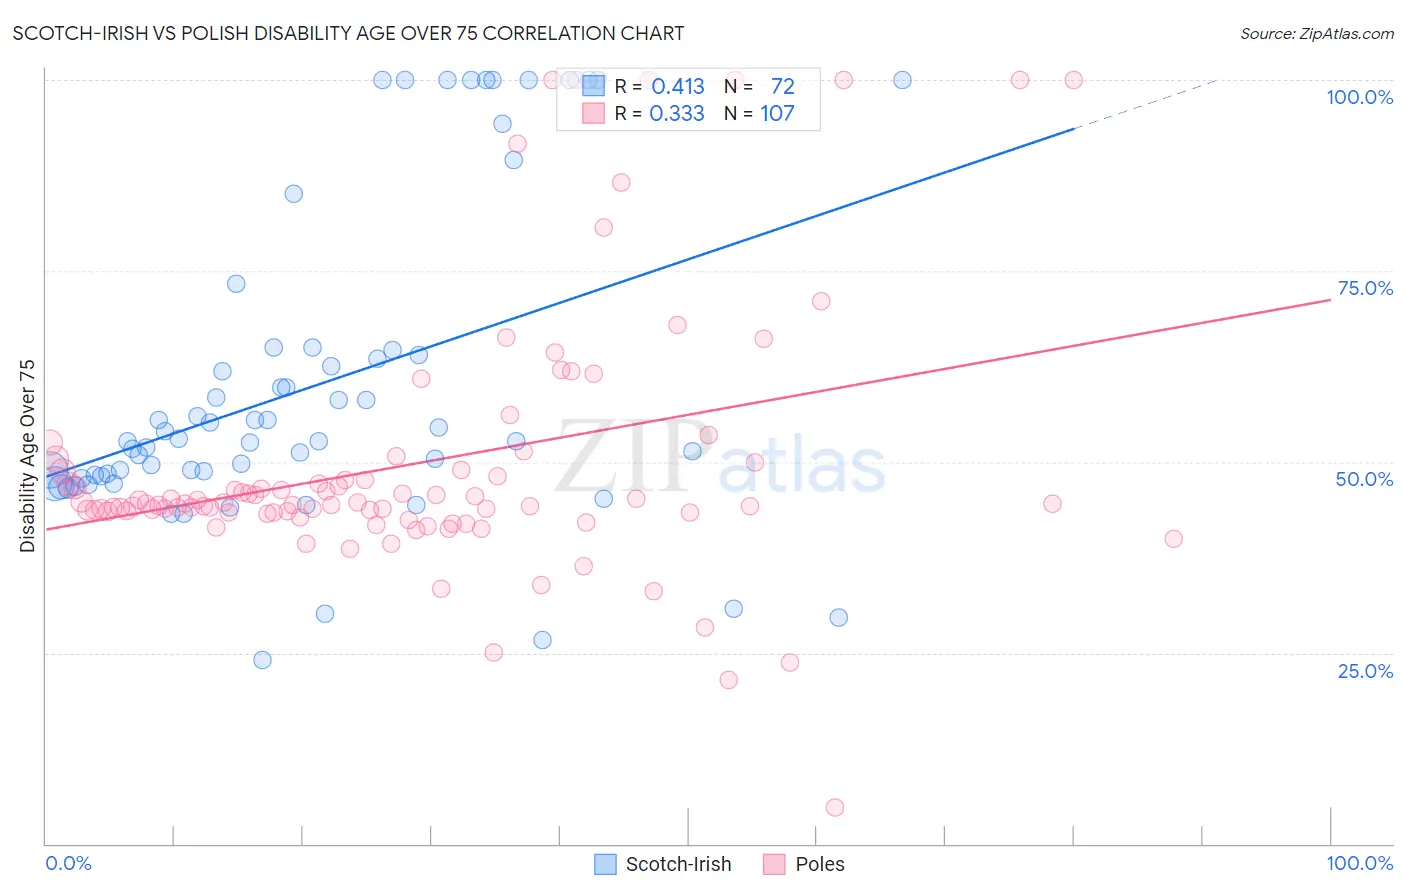
Scotch-Irish vs Polish Disability Age Over 75 Correlation Chart
The statistical analysis conducted on geographies consisting of 547,171,445 people shows a moderate positive correlation between the proportion of Scotch-Irish and percentage of population with a disability over the age of 75 in the United States with a correlation coefficient (R) of 0.413 and weighted average of 47.3%. Similarly, the statistical analysis conducted on geographies consisting of 558,502,134 people shows a mild positive correlation between the proportion of Poles and percentage of population with a disability over the age of 75 in the United States with a correlation coefficient (R) of 0.333 and weighted average of 45.3%, a difference of 4.3%.
Disability Age Over 75 Correlation Summary
| Measurement | Scotch-Irish | Polish |
| Minimum | 24.0% | 4.8% |
| Maximum | 100.0% | 100.0% |
| Range | 76.0% | 95.2% |
| Mean | 59.9% | 49.8% |
| Median | 52.7% | 44.5% |
| Interquartile 25% (IQ1) | 47.9% | 43.4% |
| Interquartile 75% (IQ3) | 64.4% | 48.9% |
| Interquartile Range (IQR) | 16.4% | 5.5% |
| Standard Deviation (Sample) | 20.7% | 17.4% |
| Standard Deviation (Population) | 20.5% | 17.3% |
Similar Demographics by Disability Age Over 75
Demographics Similar to Scotch-Irish by Disability Age Over 75
In terms of disability age over 75, the demographic groups most similar to Scotch-Irish are Alsatian (47.3%, a difference of 0.010%), Immigrants from Africa (47.3%, a difference of 0.030%), White/Caucasian (47.3%, a difference of 0.060%), Immigrants from Haiti (47.3%, a difference of 0.060%), and German Russian (47.3%, a difference of 0.080%).
| Demographics | Rating | Rank | Disability Age Over 75 |
| Immigrants | Zimbabwe | 64.4 /100 | #165 | Good 47.2% |
| Immigrants | Sierra Leone | 64.4 /100 | #166 | Good 47.2% |
| Moroccans | 62.9 /100 | #167 | Good 47.2% |
| Kenyans | 58.8 /100 | #168 | Average 47.2% |
| Celtics | 58.7 /100 | #169 | Average 47.2% |
| German Russians | 56.2 /100 | #170 | Average 47.3% |
| Immigrants | Africa | 53.6 /100 | #171 | Average 47.3% |
| Scotch-Irish | 52.5 /100 | #172 | Average 47.3% |
| Alsatians | 51.9 /100 | #173 | Average 47.3% |
| Whites/Caucasians | 50.0 /100 | #174 | Average 47.3% |
| Immigrants | Haiti | 49.7 /100 | #175 | Average 47.3% |
| Ecuadorians | 46.7 /100 | #176 | Average 47.4% |
| Haitians | 44.6 /100 | #177 | Average 47.4% |
| Cubans | 42.1 /100 | #178 | Average 47.4% |
| Sierra Leoneans | 41.7 /100 | #179 | Average 47.4% |
Demographics Similar to Poles by Disability Age Over 75
In terms of disability age over 75, the demographic groups most similar to Poles are Immigrants from Switzerland (45.3%, a difference of 0.020%), Immigrants from Bolivia (45.4%, a difference of 0.040%), Immigrants from South Africa (45.3%, a difference of 0.050%), Immigrants from Belgium (45.3%, a difference of 0.080%), and Macedonian (45.4%, a difference of 0.080%).
| Demographics | Rating | Rank | Disability Age Over 75 |
| Immigrants | India | 100.0 /100 | #17 | Exceptional 45.2% |
| Bolivians | 100.0 /100 | #18 | Exceptional 45.2% |
| Immigrants | Greece | 100.0 /100 | #19 | Exceptional 45.2% |
| Immigrants | Serbia | 100.0 /100 | #20 | Exceptional 45.3% |
| Immigrants | Belgium | 100.0 /100 | #21 | Exceptional 45.3% |
| Immigrants | South Africa | 100.0 /100 | #22 | Exceptional 45.3% |
| Immigrants | Switzerland | 99.9 /100 | #23 | Exceptional 45.3% |
| Poles | 99.9 /100 | #24 | Exceptional 45.3% |
| Immigrants | Bolivia | 99.9 /100 | #25 | Exceptional 45.4% |
| Macedonians | 99.9 /100 | #26 | Exceptional 45.4% |
| Immigrants | Poland | 99.9 /100 | #27 | Exceptional 45.4% |
| Thais | 99.9 /100 | #28 | Exceptional 45.4% |
| Filipinos | 99.9 /100 | #29 | Exceptional 45.4% |
| Immigrants | Denmark | 99.9 /100 | #30 | Exceptional 45.4% |
| Immigrants | Bulgaria | 99.9 /100 | #31 | Exceptional 45.5% |