Scotch-Irish vs Immigrants from Hungary Disability Age Over 75
COMPARE
Scotch-Irish
Immigrants from Hungary
Disability Age Over 75
Disability Age Over 75 Comparison
Scotch-Irish
Immigrants from Hungary
47.3%
DISABILITY AGE OVER 75
52.5/ 100
METRIC RATING
172nd/ 347
METRIC RANK
46.1%
DISABILITY AGE OVER 75
99.1/ 100
METRIC RATING
72nd/ 347
METRIC RANK
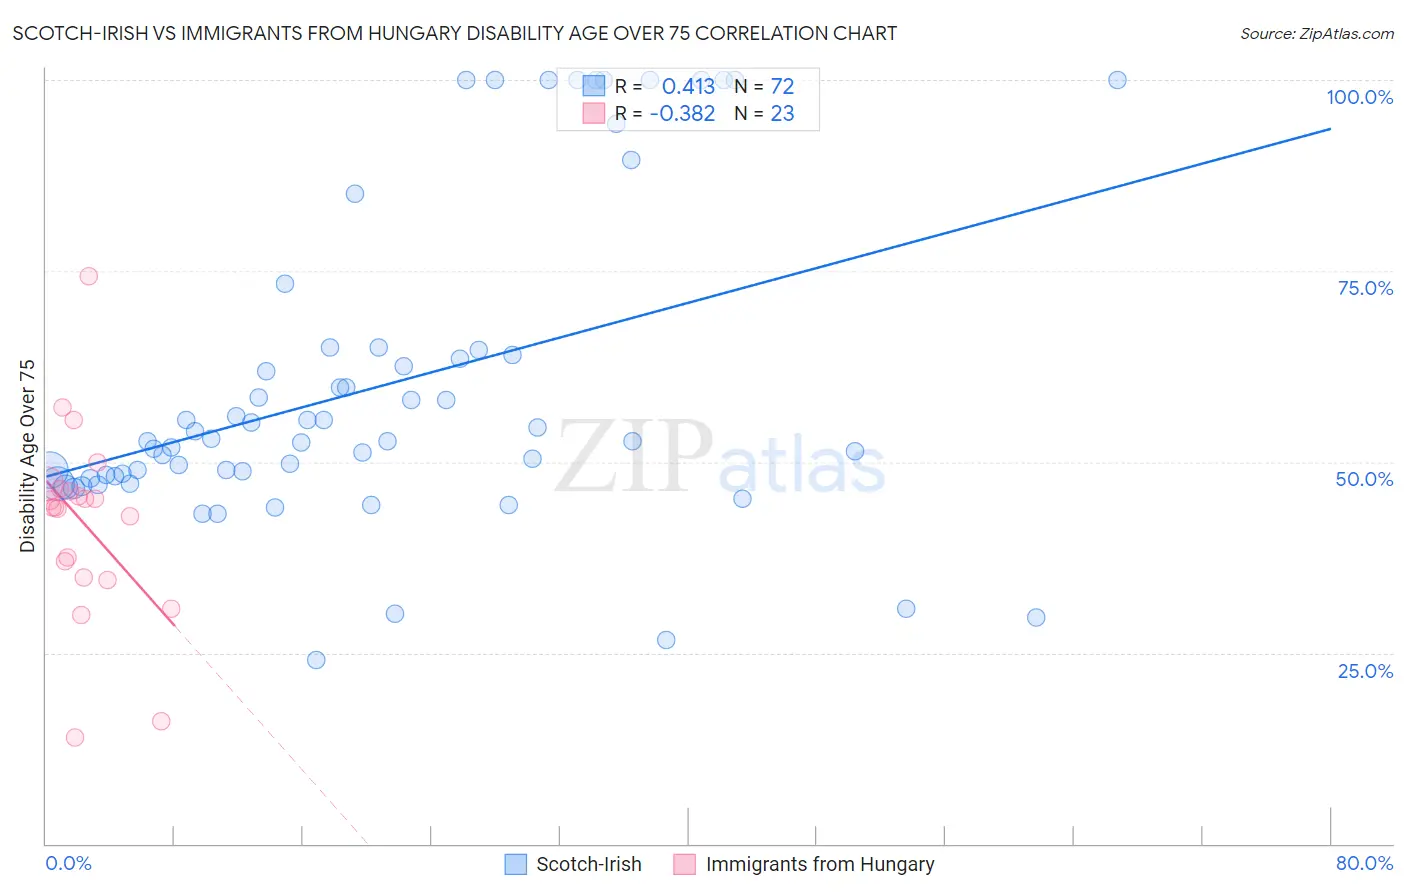
Scotch-Irish vs Immigrants from Hungary Disability Age Over 75 Correlation Chart
The statistical analysis conducted on geographies consisting of 547,171,445 people shows a moderate positive correlation between the proportion of Scotch-Irish and percentage of population with a disability over the age of 75 in the United States with a correlation coefficient (R) of 0.413 and weighted average of 47.3%. Similarly, the statistical analysis conducted on geographies consisting of 195,614,113 people shows a mild negative correlation between the proportion of Immigrants from Hungary and percentage of population with a disability over the age of 75 in the United States with a correlation coefficient (R) of -0.382 and weighted average of 46.1%, a difference of 2.7%.
Disability Age Over 75 Correlation Summary
| Measurement | Scotch-Irish | Immigrants from Hungary |
| Minimum | 24.0% | 13.9% |
| Maximum | 100.0% | 74.3% |
| Range | 76.0% | 60.4% |
| Mean | 59.9% | 42.0% |
| Median | 52.7% | 44.1% |
| Interquartile 25% (IQ1) | 47.9% | 34.9% |
| Interquartile 75% (IQ3) | 64.4% | 46.5% |
| Interquartile Range (IQR) | 16.4% | 11.6% |
| Standard Deviation (Sample) | 20.7% | 12.7% |
| Standard Deviation (Population) | 20.5% | 12.4% |
Similar Demographics by Disability Age Over 75
Demographics Similar to Scotch-Irish by Disability Age Over 75
In terms of disability age over 75, the demographic groups most similar to Scotch-Irish are Alsatian (47.3%, a difference of 0.010%), Immigrants from Africa (47.3%, a difference of 0.030%), White/Caucasian (47.3%, a difference of 0.060%), Immigrants from Haiti (47.3%, a difference of 0.060%), and German Russian (47.3%, a difference of 0.080%).
| Demographics | Rating | Rank | Disability Age Over 75 |
| Immigrants | Zimbabwe | 64.4 /100 | #165 | Good 47.2% |
| Immigrants | Sierra Leone | 64.4 /100 | #166 | Good 47.2% |
| Moroccans | 62.9 /100 | #167 | Good 47.2% |
| Kenyans | 58.8 /100 | #168 | Average 47.2% |
| Celtics | 58.7 /100 | #169 | Average 47.2% |
| German Russians | 56.2 /100 | #170 | Average 47.3% |
| Immigrants | Africa | 53.6 /100 | #171 | Average 47.3% |
| Scotch-Irish | 52.5 /100 | #172 | Average 47.3% |
| Alsatians | 51.9 /100 | #173 | Average 47.3% |
| Whites/Caucasians | 50.0 /100 | #174 | Average 47.3% |
| Immigrants | Haiti | 49.7 /100 | #175 | Average 47.3% |
| Ecuadorians | 46.7 /100 | #176 | Average 47.4% |
| Haitians | 44.6 /100 | #177 | Average 47.4% |
| Cubans | 42.1 /100 | #178 | Average 47.4% |
| Sierra Leoneans | 41.7 /100 | #179 | Average 47.4% |
Demographics Similar to Immigrants from Hungary by Disability Age Over 75
In terms of disability age over 75, the demographic groups most similar to Immigrants from Hungary are Cambodian (46.1%, a difference of 0.020%), Immigrants from Sri Lanka (46.1%, a difference of 0.030%), Egyptian (46.1%, a difference of 0.060%), Jordanian (46.1%, a difference of 0.070%), and Serbian (46.1%, a difference of 0.10%).
| Demographics | Rating | Rank | Disability Age Over 75 |
| Austrians | 99.5 /100 | #65 | Exceptional 46.0% |
| Immigrants | England | 99.5 /100 | #66 | Exceptional 46.0% |
| Immigrants | Spain | 99.4 /100 | #67 | Exceptional 46.0% |
| Immigrants | South Central Asia | 99.4 /100 | #68 | Exceptional 46.0% |
| Immigrants | Romania | 99.3 /100 | #69 | Exceptional 46.0% |
| Jordanians | 99.2 /100 | #70 | Exceptional 46.1% |
| Immigrants | Sri Lanka | 99.2 /100 | #71 | Exceptional 46.1% |
| Immigrants | Hungary | 99.1 /100 | #72 | Exceptional 46.1% |
| Cambodians | 99.1 /100 | #73 | Exceptional 46.1% |
| Egyptians | 99.0 /100 | #74 | Exceptional 46.1% |
| Serbians | 99.0 /100 | #75 | Exceptional 46.1% |
| Slavs | 98.9 /100 | #76 | Exceptional 46.1% |
| Immigrants | Eastern Asia | 98.9 /100 | #77 | Exceptional 46.2% |
| Immigrants | Western Europe | 98.8 /100 | #78 | Exceptional 46.2% |
| Swiss | 98.8 /100 | #79 | Exceptional 46.2% |