Scotch-Irish vs Czechoslovakian Disability Age Over 75
COMPARE
Scotch-Irish
Czechoslovakian
Disability Age Over 75
Disability Age Over 75 Comparison
Scotch-Irish
Czechoslovakians
47.3%
DISABILITY AGE OVER 75
52.5/ 100
METRIC RATING
172nd/ 347
METRIC RANK
46.6%
DISABILITY AGE OVER 75
94.7/ 100
METRIC RATING
118th/ 347
METRIC RANK
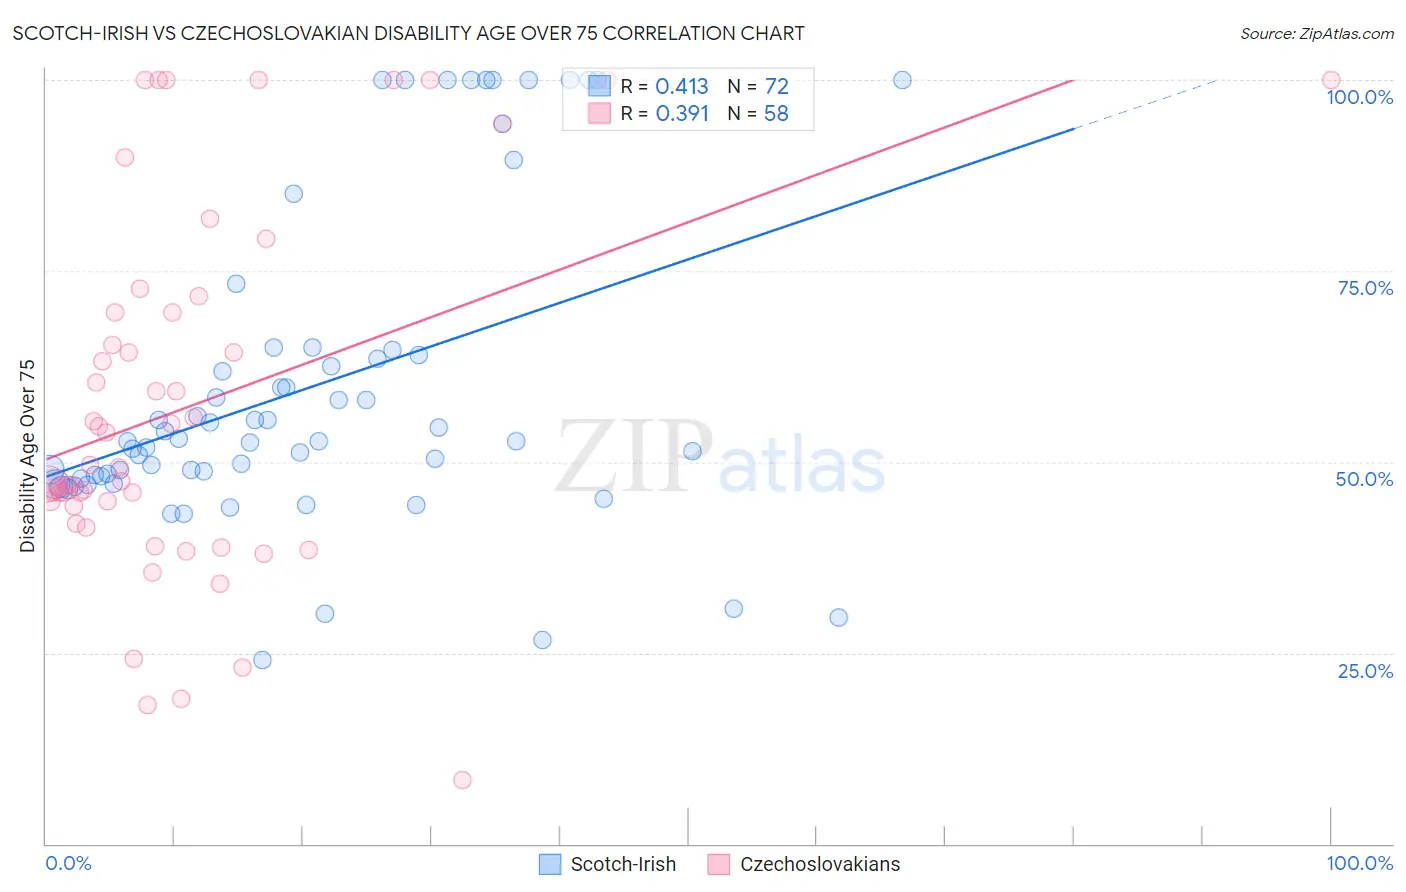
Scotch-Irish vs Czechoslovakian Disability Age Over 75 Correlation Chart
The statistical analysis conducted on geographies consisting of 547,171,445 people shows a moderate positive correlation between the proportion of Scotch-Irish and percentage of population with a disability over the age of 75 in the United States with a correlation coefficient (R) of 0.413 and weighted average of 47.3%. Similarly, the statistical analysis conducted on geographies consisting of 368,266,748 people shows a mild positive correlation between the proportion of Czechoslovakians and percentage of population with a disability over the age of 75 in the United States with a correlation coefficient (R) of 0.391 and weighted average of 46.6%, a difference of 1.6%.
Disability Age Over 75 Correlation Summary
| Measurement | Scotch-Irish | Czechoslovakian |
| Minimum | 24.0% | 8.3% |
| Maximum | 100.0% | 100.0% |
| Range | 76.0% | 91.7% |
| Mean | 59.9% | 57.3% |
| Median | 52.7% | 49.4% |
| Interquartile 25% (IQ1) | 47.9% | 44.1% |
| Interquartile 75% (IQ3) | 64.4% | 69.6% |
| Interquartile Range (IQR) | 16.4% | 25.5% |
| Standard Deviation (Sample) | 20.7% | 23.7% |
| Standard Deviation (Population) | 20.5% | 23.5% |
Similar Demographics by Disability Age Over 75
Demographics Similar to Scotch-Irish by Disability Age Over 75
In terms of disability age over 75, the demographic groups most similar to Scotch-Irish are Alsatian (47.3%, a difference of 0.010%), Immigrants from Africa (47.3%, a difference of 0.030%), White/Caucasian (47.3%, a difference of 0.060%), Immigrants from Haiti (47.3%, a difference of 0.060%), and German Russian (47.3%, a difference of 0.080%).
| Demographics | Rating | Rank | Disability Age Over 75 |
| Immigrants | Zimbabwe | 64.4 /100 | #165 | Good 47.2% |
| Immigrants | Sierra Leone | 64.4 /100 | #166 | Good 47.2% |
| Moroccans | 62.9 /100 | #167 | Good 47.2% |
| Kenyans | 58.8 /100 | #168 | Average 47.2% |
| Celtics | 58.7 /100 | #169 | Average 47.2% |
| German Russians | 56.2 /100 | #170 | Average 47.3% |
| Immigrants | Africa | 53.6 /100 | #171 | Average 47.3% |
| Scotch-Irish | 52.5 /100 | #172 | Average 47.3% |
| Alsatians | 51.9 /100 | #173 | Average 47.3% |
| Whites/Caucasians | 50.0 /100 | #174 | Average 47.3% |
| Immigrants | Haiti | 49.7 /100 | #175 | Average 47.3% |
| Ecuadorians | 46.7 /100 | #176 | Average 47.4% |
| Haitians | 44.6 /100 | #177 | Average 47.4% |
| Cubans | 42.1 /100 | #178 | Average 47.4% |
| Sierra Leoneans | 41.7 /100 | #179 | Average 47.4% |
Demographics Similar to Czechoslovakians by Disability Age Over 75
In terms of disability age over 75, the demographic groups most similar to Czechoslovakians are Canadian (46.6%, a difference of 0.030%), Immigrants from Nepal (46.6%, a difference of 0.060%), Hungarian (46.5%, a difference of 0.080%), Scandinavian (46.6%, a difference of 0.10%), and Indian (Asian) (46.5%, a difference of 0.13%).
| Demographics | Rating | Rank | Disability Age Over 75 |
| Immigrants | Chile | 96.4 /100 | #111 | Exceptional 46.5% |
| Immigrants | Pakistan | 96.1 /100 | #112 | Exceptional 46.5% |
| Irish | 96.0 /100 | #113 | Exceptional 46.5% |
| Dutch | 95.9 /100 | #114 | Exceptional 46.5% |
| British | 95.7 /100 | #115 | Exceptional 46.5% |
| Indians (Asian) | 95.7 /100 | #116 | Exceptional 46.5% |
| Hungarians | 95.3 /100 | #117 | Exceptional 46.5% |
| Czechoslovakians | 94.7 /100 | #118 | Exceptional 46.6% |
| Canadians | 94.4 /100 | #119 | Exceptional 46.6% |
| Immigrants | Nepal | 94.1 /100 | #120 | Exceptional 46.6% |
| Scandinavians | 93.6 /100 | #121 | Exceptional 46.6% |
| Immigrants | Albania | 93.2 /100 | #122 | Exceptional 46.6% |
| Immigrants | Colombia | 92.6 /100 | #123 | Exceptional 46.7% |
| Immigrants | South America | 91.8 /100 | #124 | Exceptional 46.7% |
| Colombians | 91.3 /100 | #125 | Exceptional 46.7% |