Scotch-Irish vs Immigrants from Ukraine Disability Age Over 75
COMPARE
Scotch-Irish
Immigrants from Ukraine
Disability Age Over 75
Disability Age Over 75 Comparison
Scotch-Irish
Immigrants from Ukraine
47.3%
DISABILITY AGE OVER 75
52.5/ 100
METRIC RATING
172nd/ 347
METRIC RANK
47.7%
DISABILITY AGE OVER 75
23.2/ 100
METRIC RATING
198th/ 347
METRIC RANK
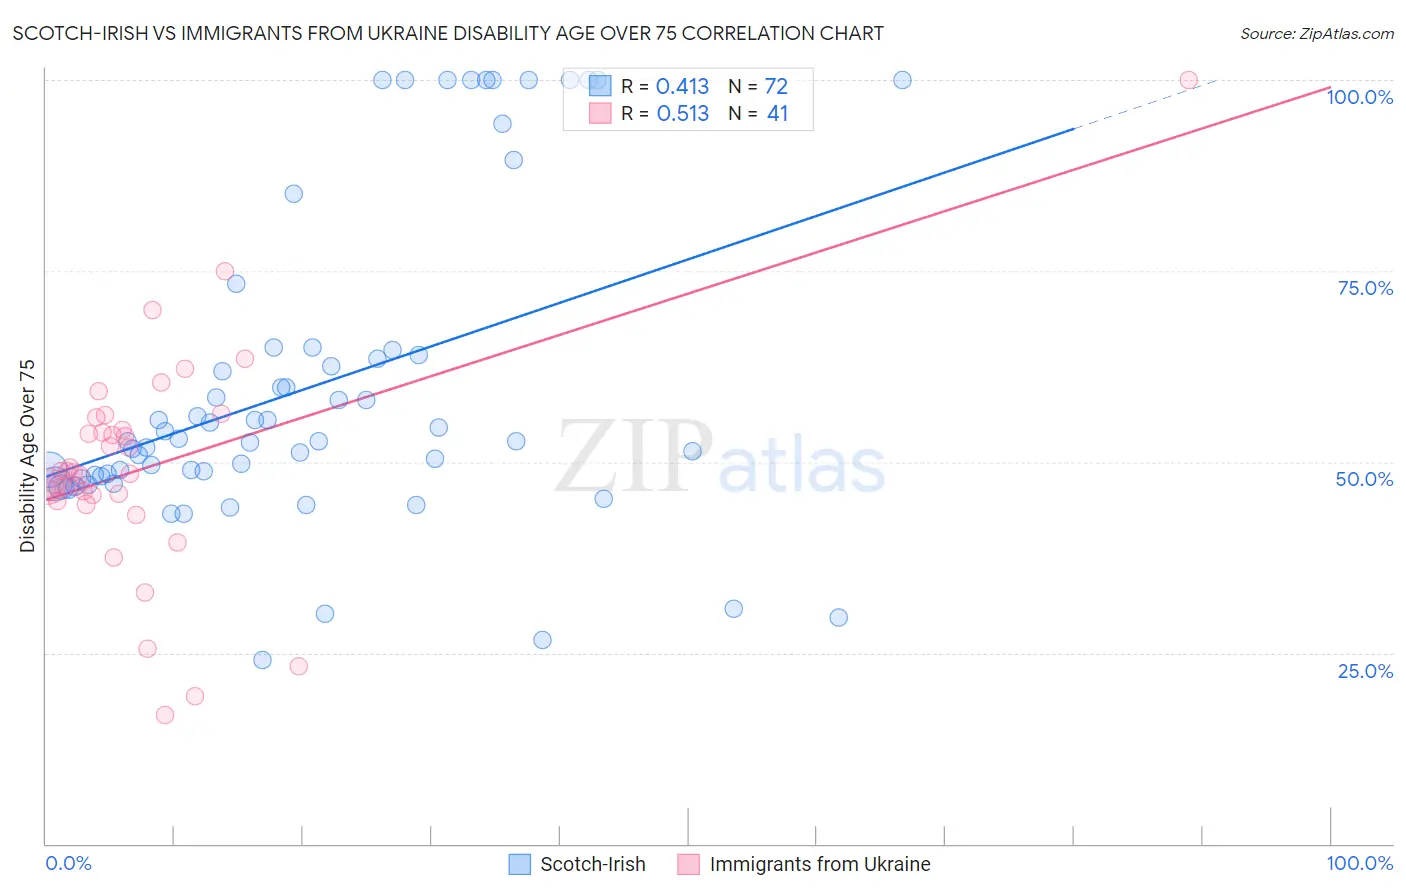
Scotch-Irish vs Immigrants from Ukraine Disability Age Over 75 Correlation Chart
The statistical analysis conducted on geographies consisting of 547,171,445 people shows a moderate positive correlation between the proportion of Scotch-Irish and percentage of population with a disability over the age of 75 in the United States with a correlation coefficient (R) of 0.413 and weighted average of 47.3%. Similarly, the statistical analysis conducted on geographies consisting of 289,393,275 people shows a substantial positive correlation between the proportion of Immigrants from Ukraine and percentage of population with a disability over the age of 75 in the United States with a correlation coefficient (R) of 0.513 and weighted average of 47.7%, a difference of 0.73%.
Disability Age Over 75 Correlation Summary
| Measurement | Scotch-Irish | Immigrants from Ukraine |
| Minimum | 24.0% | 16.9% |
| Maximum | 100.0% | 100.0% |
| Range | 76.0% | 83.1% |
| Mean | 59.9% | 49.3% |
| Median | 52.7% | 48.7% |
| Interquartile 25% (IQ1) | 47.9% | 45.2% |
| Interquartile 75% (IQ3) | 64.4% | 55.0% |
| Interquartile Range (IQR) | 16.4% | 9.8% |
| Standard Deviation (Sample) | 20.7% | 14.4% |
| Standard Deviation (Population) | 20.5% | 14.3% |
Similar Demographics by Disability Age Over 75
Demographics Similar to Scotch-Irish by Disability Age Over 75
In terms of disability age over 75, the demographic groups most similar to Scotch-Irish are Alsatian (47.3%, a difference of 0.010%), Immigrants from Africa (47.3%, a difference of 0.030%), White/Caucasian (47.3%, a difference of 0.060%), Immigrants from Haiti (47.3%, a difference of 0.060%), and German Russian (47.3%, a difference of 0.080%).
| Demographics | Rating | Rank | Disability Age Over 75 |
| Immigrants | Zimbabwe | 64.4 /100 | #165 | Good 47.2% |
| Immigrants | Sierra Leone | 64.4 /100 | #166 | Good 47.2% |
| Moroccans | 62.9 /100 | #167 | Good 47.2% |
| Kenyans | 58.8 /100 | #168 | Average 47.2% |
| Celtics | 58.7 /100 | #169 | Average 47.2% |
| German Russians | 56.2 /100 | #170 | Average 47.3% |
| Immigrants | Africa | 53.6 /100 | #171 | Average 47.3% |
| Scotch-Irish | 52.5 /100 | #172 | Average 47.3% |
| Alsatians | 51.9 /100 | #173 | Average 47.3% |
| Whites/Caucasians | 50.0 /100 | #174 | Average 47.3% |
| Immigrants | Haiti | 49.7 /100 | #175 | Average 47.3% |
| Ecuadorians | 46.7 /100 | #176 | Average 47.4% |
| Haitians | 44.6 /100 | #177 | Average 47.4% |
| Cubans | 42.1 /100 | #178 | Average 47.4% |
| Sierra Leoneans | 41.7 /100 | #179 | Average 47.4% |
Demographics Similar to Immigrants from Ukraine by Disability Age Over 75
In terms of disability age over 75, the demographic groups most similar to Immigrants from Ukraine are Pakistani (47.7%, a difference of 0.010%), Immigrants from Portugal (47.6%, a difference of 0.020%), Immigrants from Eritrea (47.7%, a difference of 0.020%), Immigrants from Trinidad and Tobago (47.6%, a difference of 0.060%), and Immigrants from Somalia (47.7%, a difference of 0.060%).
| Demographics | Rating | Rank | Disability Age Over 75 |
| Portuguese | 29.3 /100 | #191 | Fair 47.6% |
| Immigrants | Jamaica | 28.3 /100 | #192 | Fair 47.6% |
| Ottawa | 28.1 /100 | #193 | Fair 47.6% |
| Immigrants | Lebanon | 26.5 /100 | #194 | Fair 47.6% |
| Immigrants | Trinidad and Tobago | 25.3 /100 | #195 | Fair 47.6% |
| Immigrants | Portugal | 23.8 /100 | #196 | Fair 47.6% |
| Pakistanis | 23.4 /100 | #197 | Fair 47.7% |
| Immigrants | Ukraine | 23.2 /100 | #198 | Fair 47.7% |
| Immigrants | Eritrea | 22.4 /100 | #199 | Fair 47.7% |
| Immigrants | Somalia | 21.4 /100 | #200 | Fair 47.7% |
| Immigrants | Cuba | 20.9 /100 | #201 | Fair 47.7% |
| Immigrants | Bahamas | 20.7 /100 | #202 | Fair 47.7% |
| Trinidadians and Tobagonians | 20.0 /100 | #203 | Fair 47.7% |
| Nigerians | 19.2 /100 | #204 | Poor 47.7% |
| Immigrants | Ghana | 19.1 /100 | #205 | Poor 47.7% |