Scotch-Irish vs German Disability Age Over 75
COMPARE
Scotch-Irish
German
Disability Age Over 75
Disability Age Over 75 Comparison
Scotch-Irish
Germans
47.3%
DISABILITY AGE OVER 75
52.5/ 100
METRIC RATING
172nd/ 347
METRIC RANK
46.3%
DISABILITY AGE OVER 75
98.2/ 100
METRIC RATING
92nd/ 347
METRIC RANK
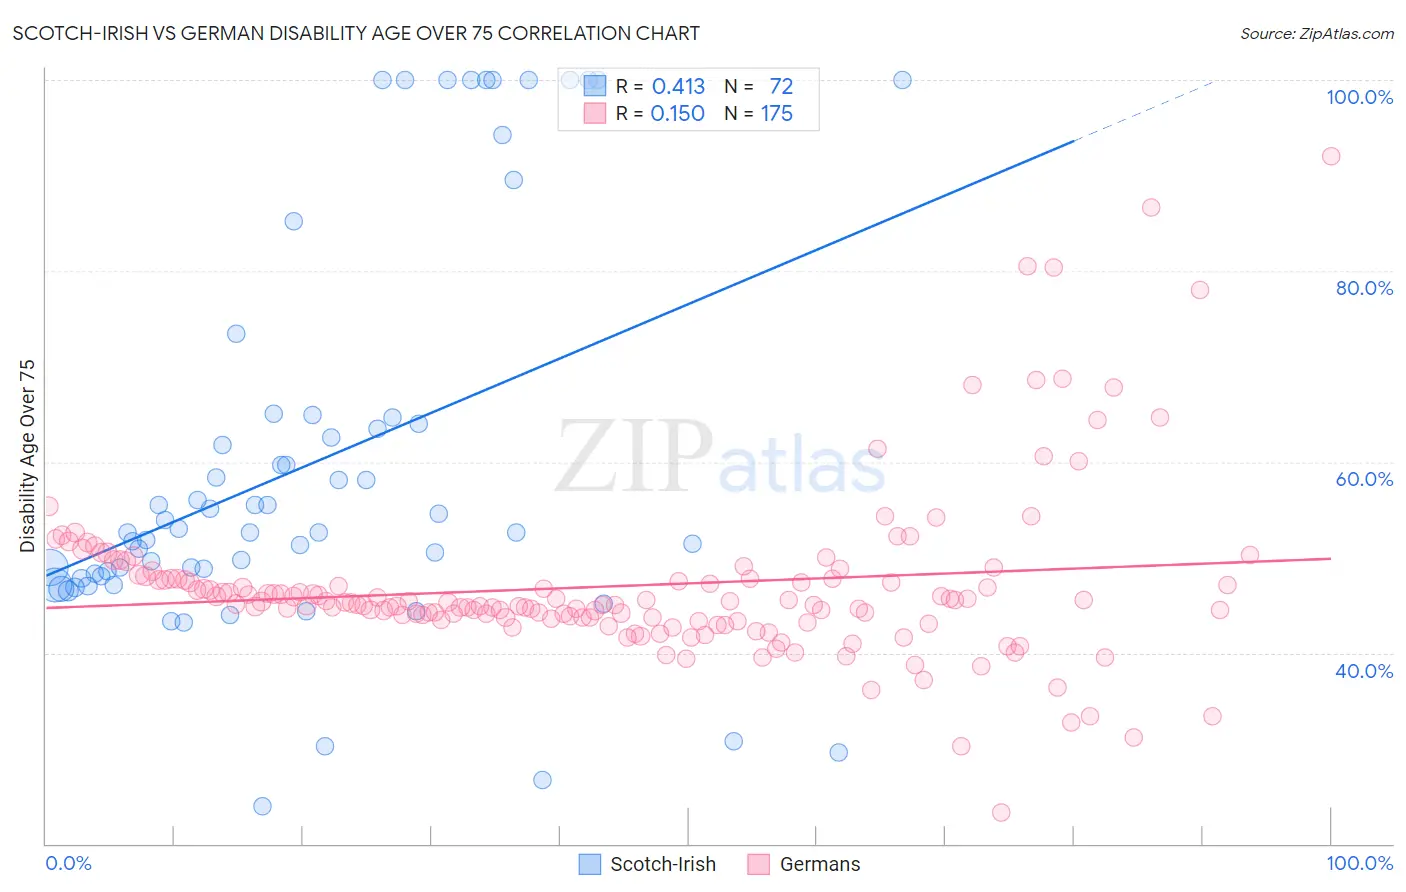
Scotch-Irish vs German Disability Age Over 75 Correlation Chart
The statistical analysis conducted on geographies consisting of 547,171,445 people shows a moderate positive correlation between the proportion of Scotch-Irish and percentage of population with a disability over the age of 75 in the United States with a correlation coefficient (R) of 0.413 and weighted average of 47.3%. Similarly, the statistical analysis conducted on geographies consisting of 578,361,531 people shows a poor positive correlation between the proportion of Germans and percentage of population with a disability over the age of 75 in the United States with a correlation coefficient (R) of 0.150 and weighted average of 46.3%, a difference of 2.2%.
Disability Age Over 75 Correlation Summary
| Measurement | Scotch-Irish | German |
| Minimum | 24.0% | 23.2% |
| Maximum | 100.0% | 92.0% |
| Range | 76.0% | 68.8% |
| Mean | 59.9% | 47.0% |
| Median | 52.7% | 45.2% |
| Interquartile 25% (IQ1) | 47.9% | 43.6% |
| Interquartile 75% (IQ3) | 64.4% | 47.8% |
| Interquartile Range (IQR) | 16.4% | 4.1% |
| Standard Deviation (Sample) | 20.7% | 8.9% |
| Standard Deviation (Population) | 20.5% | 8.9% |
Similar Demographics by Disability Age Over 75
Demographics Similar to Scotch-Irish by Disability Age Over 75
In terms of disability age over 75, the demographic groups most similar to Scotch-Irish are Alsatian (47.3%, a difference of 0.010%), Immigrants from Africa (47.3%, a difference of 0.030%), White/Caucasian (47.3%, a difference of 0.060%), Immigrants from Haiti (47.3%, a difference of 0.060%), and German Russian (47.3%, a difference of 0.080%).
| Demographics | Rating | Rank | Disability Age Over 75 |
| Immigrants | Zimbabwe | 64.4 /100 | #165 | Good 47.2% |
| Immigrants | Sierra Leone | 64.4 /100 | #166 | Good 47.2% |
| Moroccans | 62.9 /100 | #167 | Good 47.2% |
| Kenyans | 58.8 /100 | #168 | Average 47.2% |
| Celtics | 58.7 /100 | #169 | Average 47.2% |
| German Russians | 56.2 /100 | #170 | Average 47.3% |
| Immigrants | Africa | 53.6 /100 | #171 | Average 47.3% |
| Scotch-Irish | 52.5 /100 | #172 | Average 47.3% |
| Alsatians | 51.9 /100 | #173 | Average 47.3% |
| Whites/Caucasians | 50.0 /100 | #174 | Average 47.3% |
| Immigrants | Haiti | 49.7 /100 | #175 | Average 47.3% |
| Ecuadorians | 46.7 /100 | #176 | Average 47.4% |
| Haitians | 44.6 /100 | #177 | Average 47.4% |
| Cubans | 42.1 /100 | #178 | Average 47.4% |
| Sierra Leoneans | 41.7 /100 | #179 | Average 47.4% |
Demographics Similar to Germans by Disability Age Over 75
In terms of disability age over 75, the demographic groups most similar to Germans are Ugandan (46.3%, a difference of 0.0%), Albanian (46.3%, a difference of 0.040%), Northern European (46.3%, a difference of 0.050%), Immigrants from Egypt (46.3%, a difference of 0.050%), and Immigrants from Brazil (46.3%, a difference of 0.060%).
| Demographics | Rating | Rank | Disability Age Over 75 |
| Immigrants | Southern Europe | 98.6 /100 | #85 | Exceptional 46.2% |
| Romanians | 98.6 /100 | #86 | Exceptional 46.2% |
| Danes | 98.6 /100 | #87 | Exceptional 46.2% |
| Uruguayans | 98.4 /100 | #88 | Exceptional 46.2% |
| Immigrants | Saudi Arabia | 98.4 /100 | #89 | Exceptional 46.3% |
| Northern Europeans | 98.3 /100 | #90 | Exceptional 46.3% |
| Immigrants | Egypt | 98.3 /100 | #91 | Exceptional 46.3% |
| Germans | 98.2 /100 | #92 | Exceptional 46.3% |
| Ugandans | 98.2 /100 | #93 | Exceptional 46.3% |
| Albanians | 98.1 /100 | #94 | Exceptional 46.3% |
| Immigrants | Brazil | 98.0 /100 | #95 | Exceptional 46.3% |
| Immigrants | China | 98.0 /100 | #96 | Exceptional 46.3% |
| Finns | 97.9 /100 | #97 | Exceptional 46.3% |
| Immigrants | Japan | 97.8 /100 | #98 | Exceptional 46.3% |
| Palestinians | 97.7 /100 | #99 | Exceptional 46.3% |